Dedicated Valheim server with insights
In this blog post, I will talk about how I have set up our server on Google Cloud, installed Valheim, and added some metrics to Grafana Cloud. Valheim is a brutal exploration and survival game for 1-10 players, set in a procedurally-generated purgatory inspired by viking culture. At Fullstaq where I work, we wanted to be able to play this game on our own server!
But Wiard, you are a Kubernetes fanboy, why a VPS?
I like Kubernetes. Yet it's not the solution to everything. What I wanted was a minimum effort, maximum satisfaction. Hosting a game-server, especially one like Valheim is not that suitable for a cloud-native build. Especially when I only want one server. It requires a volume, it cannot be scaled over multiple instances/pods nor is there any way to make it highly available. I also need multiple TCP & UDP ports to be available, which is doable in Kubernetes but it's not that simple as an HTTP load balancer.
Google Cloud Compute Engine
I manually added an instance "e2-medium (2 vCPUs, 4 GB memory)" with the image "ubuntu-1604-xenial-v20210211" and gave it a 30GB SSD persistent disk.
I also gave it a network tag "valheim" for our firewall setup later on.
Why manual and not via Terraform or any other form of infra-as-code? Because it's just a one-time thing. It's going to be a temporary project. Let me show you this XKCD https://xkcd.com/1205/

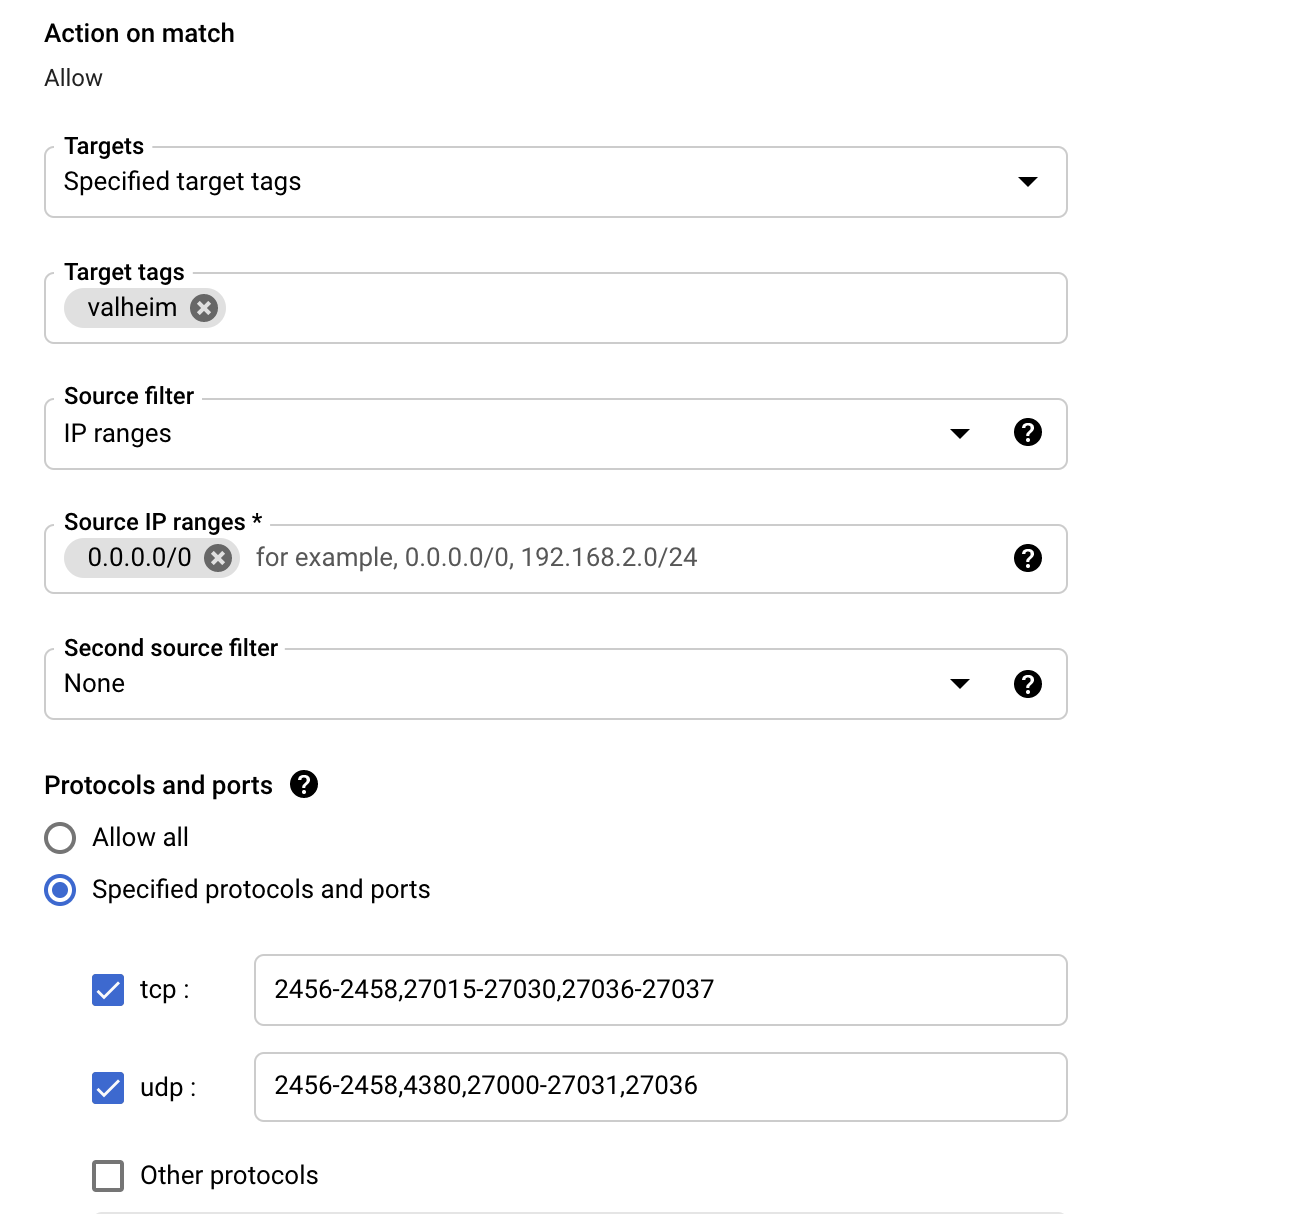
Firewall
For TCP I opened: 2456-2458,27015-27030,27036-27037 For UDP: 2456-2458,4380,27000-27031,27036 The source range is 0.0.0.0/0 (everything) and the target we do by our tag "valheim".
Linux GSM
Linux Game Server Manager is something I found while using Google on how to host a Valheim server. https://linuxgsm.com/ - It's pretty great to just set something up.
Let me talk you through on how to set this up;
Adding dependecies:
1sudo dpkg --add-architecture i386; sudo apt update; sudo apt install curl wget file tar bzip2 gzip unzip bsdmainutils python util-linux ca-certificates binutils bc jq tmux netcat lib32gcc1 lib32stdc++6 steamcmd libsdl2-2.0-0:i386 libsdl2-2.0-0
Adding the user (which needs sudo rights)
1sudo adduser vhserver
Adding sudo rights
1sudo visudo
And then add the following:
1vhserver ALL=(ALL) NOPASSWD:ALL
Next we move towards our user and start installing things:
1su - vhserver
2wget -O linuxgsm.sh https://linuxgsm.sh && chmod +x linuxgsm.sh && bash linuxgsm.sh vhserver
3./vhserver install
And follow the instructions that follow in the install.
I recommend reading the usage of vhserver here: https://linuxgsm.com/lgsm/vhserver/
Configuration
Next we add a file for our gameserver that overrides the defaults:
1vi /home/vhserver/lgsm/config-lgsm/vhserver/vhserver.cfg
In which you can add the following:
1steammaster="true"
2servername="YourServerName"
3# Minimum password length is 5.
4serverpassword="yourpassword"
5port="2456"
6gameworld="${selfname}"
7public="1"
You also could view the configuration in /home/vhserver/lgsm/config-lgsm/vhserver/_default.cfg and change values of this by adding them to /home/vhserver/lgsm/config-lgsm/vhserver/common.cfg
Getting insights
So I also wanted to monitoring our server or alteast have some insights. Therefor I will use Prometheus with a Prometheus node exporter and Grafana cloud.
setting up Grafana cloud
Go to: https://grafana.com/signup/cloud/connect-account?pg=prod-cloud&plcmt=hero-btn1
Which gives free forever access:
- 3 users
- 10k active metrics
- 50GB Logs
- 2 week data retention
When you are all set, login and go to: https://grafana.com/orgs/{your-org-name}/api-keys and generate an API key with the role MetricsPublisher
Save this data for our next steps, as we are going to write Prometheus data to this.
Prometheus setup
I'm just going to copy/paste my commands. If you want more information on what/how, I would recommend reading other guides on how Prometheus works and how to properly set this up.
 1sudo useradd --no-create-home --shell /bin/false prometheus
 2sudo useradd --no-create-home --shell /bin/false node_exporter
 3sudo mkdir /etc/prometheus
 4sudo mkdir /var/lib/prometheus
 5sudo chown prometheus:prometheus /etc/prometheus
 6sudo chown prometheus:prometheus /var/lib/prometheus
 7cd ~
 8curl -LO https://github.com/prometheus/prometheus/releases/download/v2.25.0/prometheus-2.25.0.linux-amd64.tar.gz
 9tar xvf prometheus-2.25.0.linux-amd64.tar.gz
10sudo cp prometheus-2.25.0.linux-amd64/prometheus /usr/local/bin/
11sudo cp prometheus-2.25.0.linux-amd64/promtool /usr/local/bin/
12sudo chown prometheus:prometheus /usr/local/bin/prometheus
13sudo chown prometheus:prometheus /usr/local/bin/promtool
14sudo cp -r prometheus-2.25.0.linux-amd64/consoles /etc/prometheus
15sudo cp -r prometheus-2.25.0.linux-amd64/console_libraries /etc/prometheus
16sudo chown -R prometheus:prometheus /etc/prometheus/consoles
17sudo chown -R prometheus:prometheus /etc/prometheus/console_libraries
18rm -rf prometheus-2.25.0.linux-amd64.tar.gz prometheus-2.25.0.linux-amd64
We are also going to use a node exporter:
1curl -LO https://github.com/prometheus/node_exporter/releases/download/v1.1.1/node_exporter-1.1.1.linux-amd64.tar.gz
2tar -xvf node_exporter-1.1.1.linux-amd64.tar.gz
3sudo cp node_exporter-1.1.1.linux-amd64/node_exporter /usr/local/bin/
Setting up Prometheus configuration
sudo vi /etc/prometheus/prometheus.yml
Adding the folowing with the API key data we have created in our Grafana cloud step.
 1global:
 2  scrape_interval: 15s
 3
 4remote_write:
 5- url: https://prometheus-us-central1.grafana.net/api/prom/push
 6  basic_auth:
 7    username: your-grafana-cloud-user
 8    password: your-grafana-cloud-password
 9
10scrape_configs:
11  - job_name: 'prometheus'
12    scrape_interval: 5s
13    static_configs:
14      - targets: ['localhost:9090']
15  - job_name: 'node'
16    scrape_interval: 5s
17    static_configs:
18      - targets: ['localhost:9100']
And finish with setting the right chown:
1sudo chown prometheus:prometheus /etc/prometheus/prometheus.yml
Now we add a service for Prometheus:
1sudo vi /etc/systemd/system/prometheus.service
Adding:
 1[Unit]
 2Description=Prometheus
 3Wants=network-online.target
 4After=network-online.target
 5
 6[Service]
 7User=prometheus
 8Group=prometheus
 9Type=simple
10ExecStart=/usr/local/bin/prometheus \
11    --config.file /etc/prometheus/prometheus.yml \
12    --storage.tsdb.retention=1d \
13    --storage.tsdb.path /var/lib/prometheus/ \
14    --web.console.templates=/etc/prometheus/consoles \
15    --web.console.libraries=/etc/prometheus/console_libraries
16
17[Install]
18WantedBy=multi-user.target
And a service for our node exporter:
1sudo vi /etc/systemd/system/node_exporter.service
Adding:
 1[Unit]
 2Description=Node Exporter
 3Wants=network-online.target
 4After=network-online.target
 5
 6[Service]
 7User=node_exporter
 8Group=node_exporter
 9Type=simple
10ExecStart=/usr/local/bin/node_exporter --collector.systemd --collector.processes
11
12[Install]
13WantedBy=multi-user.target
And enabling and starting everything:
1sudo systemctl daemon-reload
2sudo systemctl start prometheus
3sudo systemctl enable prometheus
4sudo systemctl start node_exporter
5sudo systemctl enable node_exporter
Now we can also start our game server with:
1./vhserver start
Grafana dashboard
Next we can go to Grafana and add a dashboard. I have used this one: https://grafana.com/grafana/dashboards/1860 which can be added by importing a dashboard and inputting ID: 1860
When metrics are coming in, you eventually should end up with something like this:
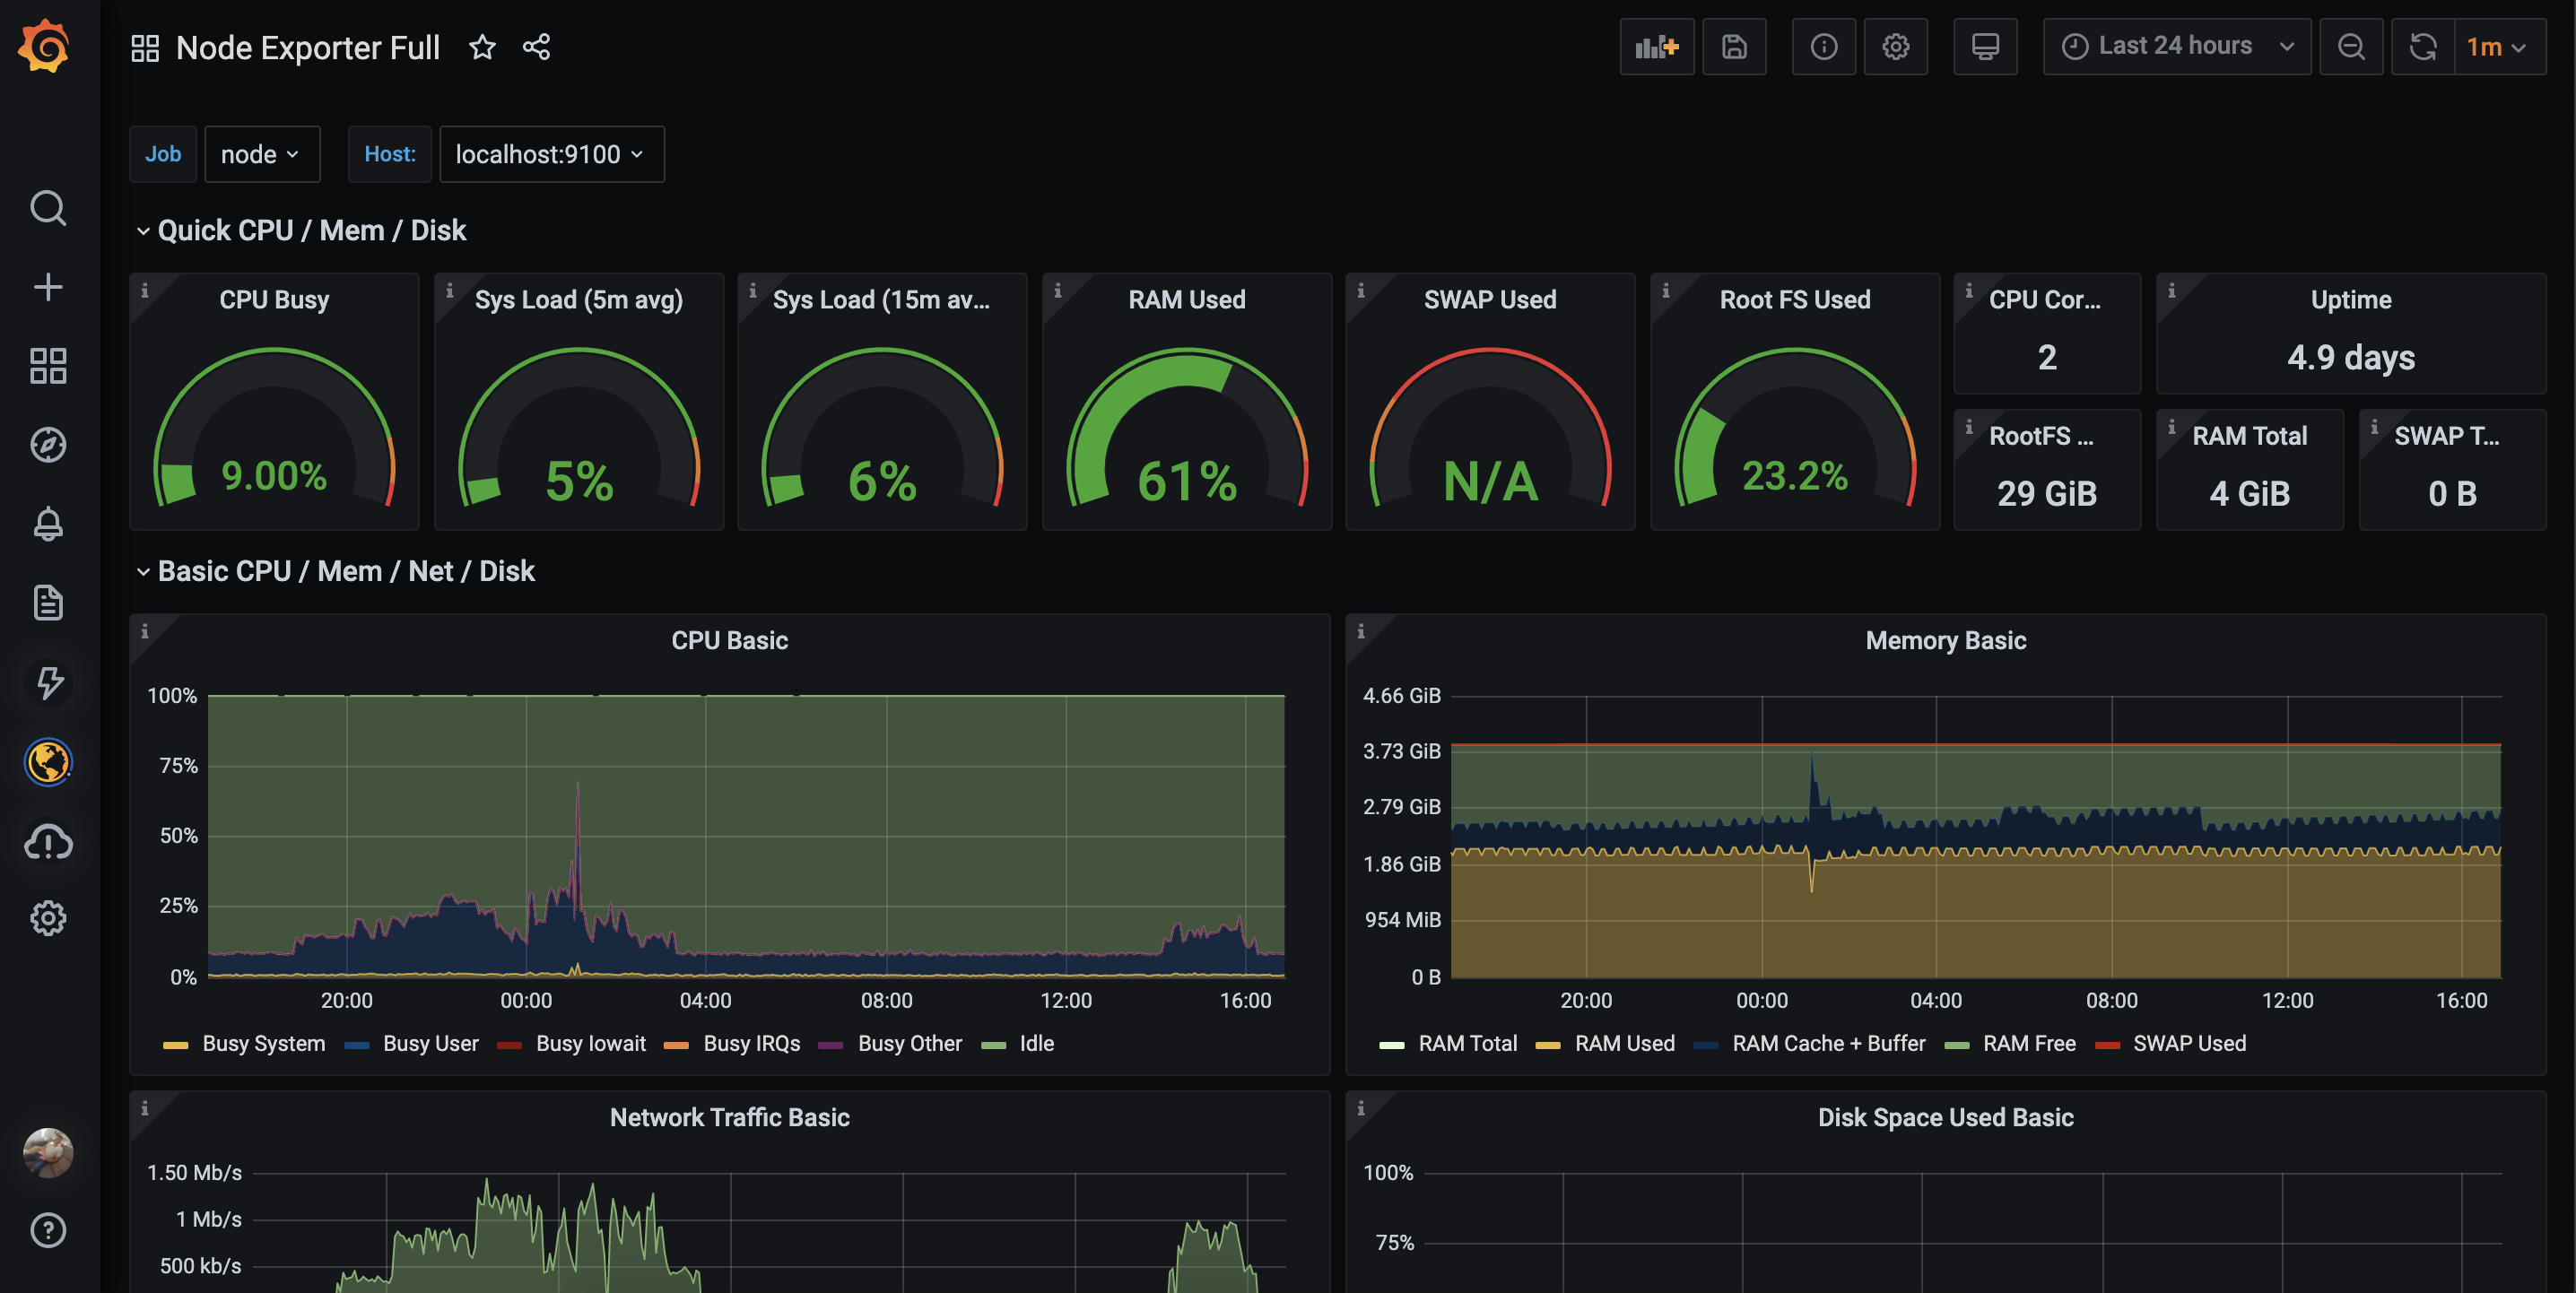
Enjoy playing Valheim!