Monthly reports with Grafana and Prometheus
How to query Prometheus for monthly data in Grafana
When searching online, there is a lot of information to find. Yet a lot of the queries and solutions might be really overcomplicated or even out-dated due to new features in both Prometheus and Grafana.
For example, I've came across this query which is pretty high in the search results:
1up{job="prometheus"} + ignoring(year, month, day) group_right
2  count_values without() ("year", year(timestamp(
3    count_values without() ("month", month(timestamp(
4      count_values without() ("day", day_of_month(timestamp(
5        up{job="prometheus"}
6      )))
7    )))
8  ))) * 0
Also there is a really good blogpost (https://www.robustperception.io/monthly-reporting-with-prometheus-and-python), and I'll quote them right now:
While PromQL has some calendar functions, it's designed more for doing math over arbitrary fixed time periods rather than time periods that vary over time due to business logic. Which is to say that as different months have different numbers of days, it's not possible to do monthly reporting directly in PromQL
I would like to 'extend' that blogpost, rather than using Python: using Grafana for it!
In this example, I'm graphing the amount of Jaeger spans recieved. We can do this with a Query like this:
1sum(increase(jaeger_collector_spans_received_total{job="jaeger-something"}[1d]))
This would result in the increase per [1d], sum'd by each svc that is pushing their spans. Now just to see what we have, I'm using the Grafana Table panel to visualize it.
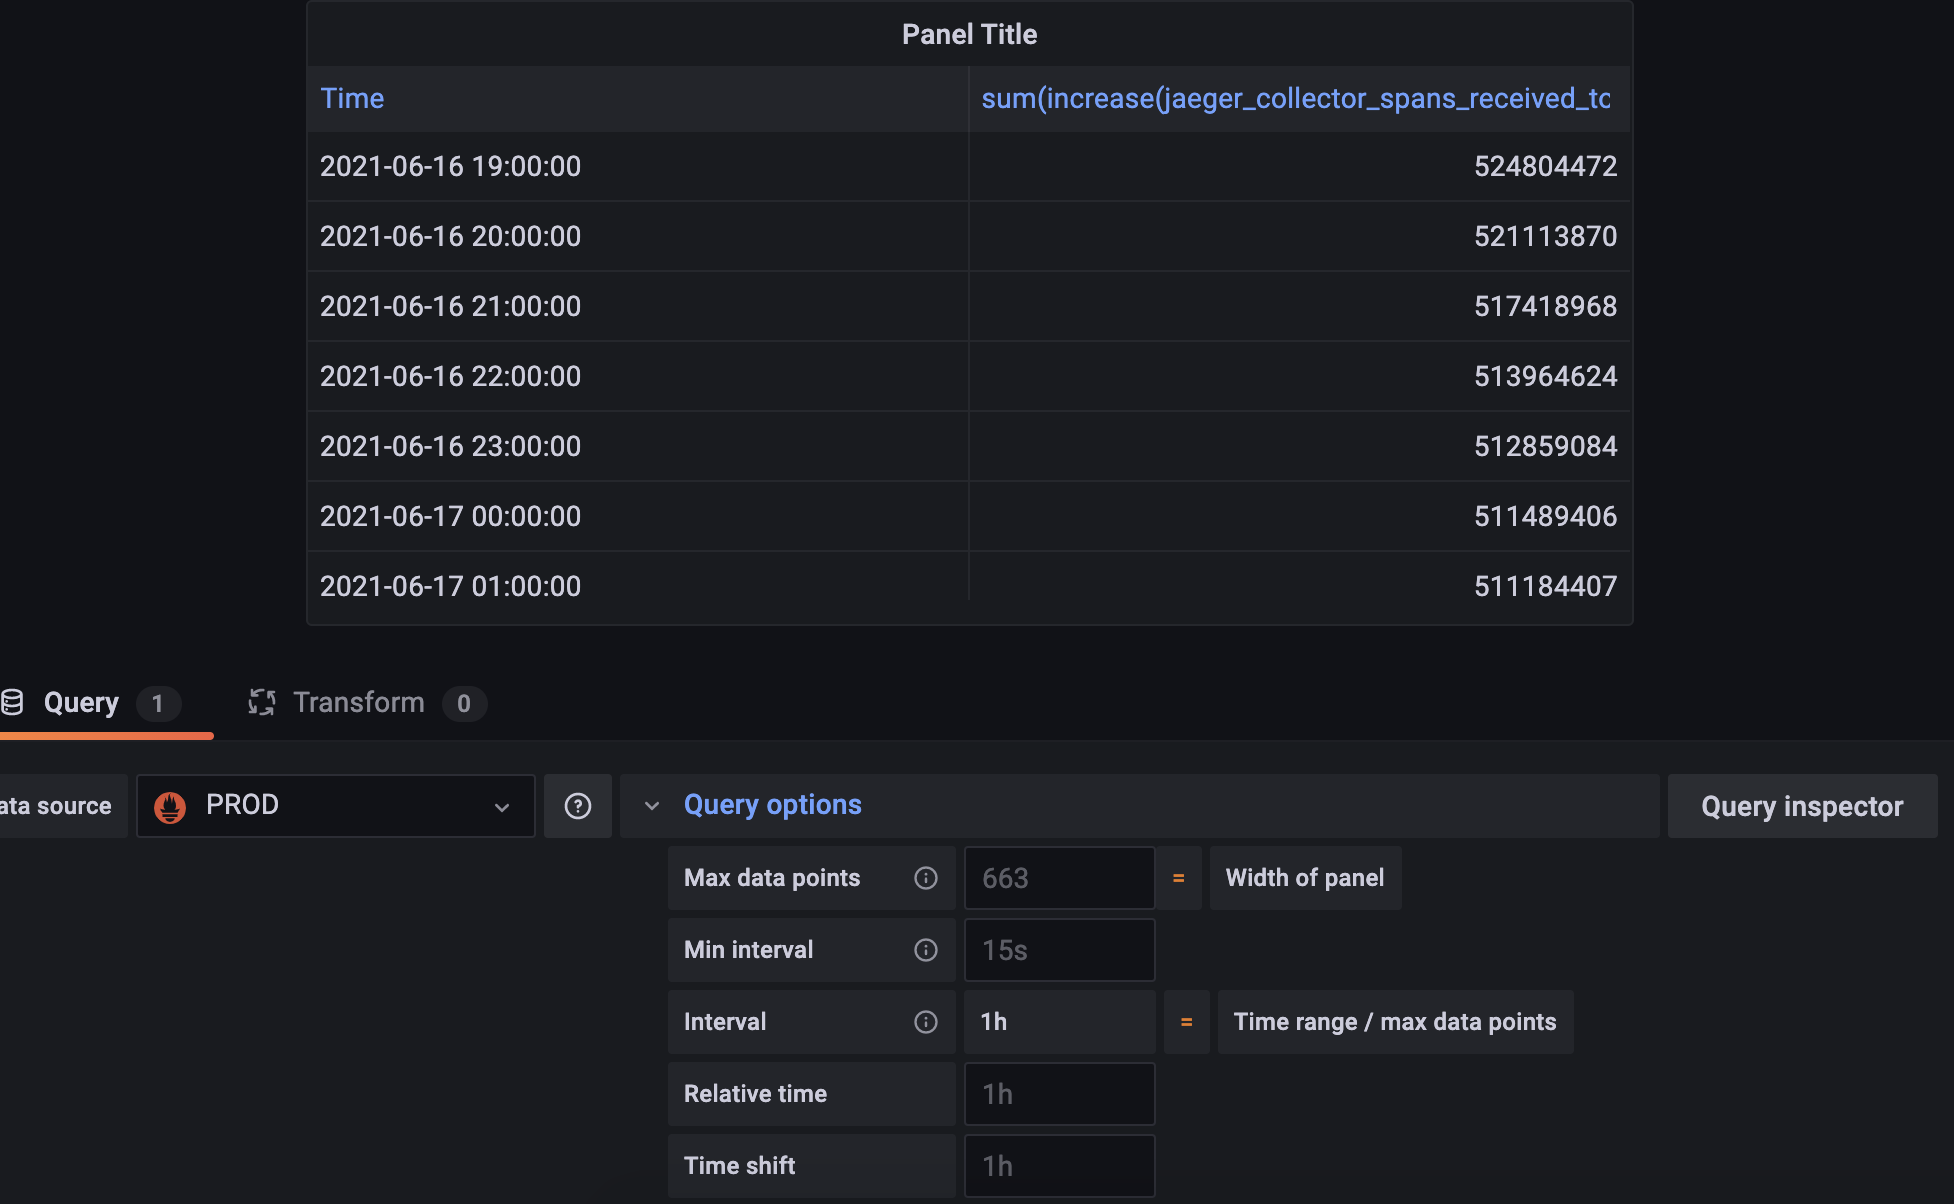
This might be a bit confusing, why do we have 'hourly data'? Well, this is just the interval. Let's just visualize it:
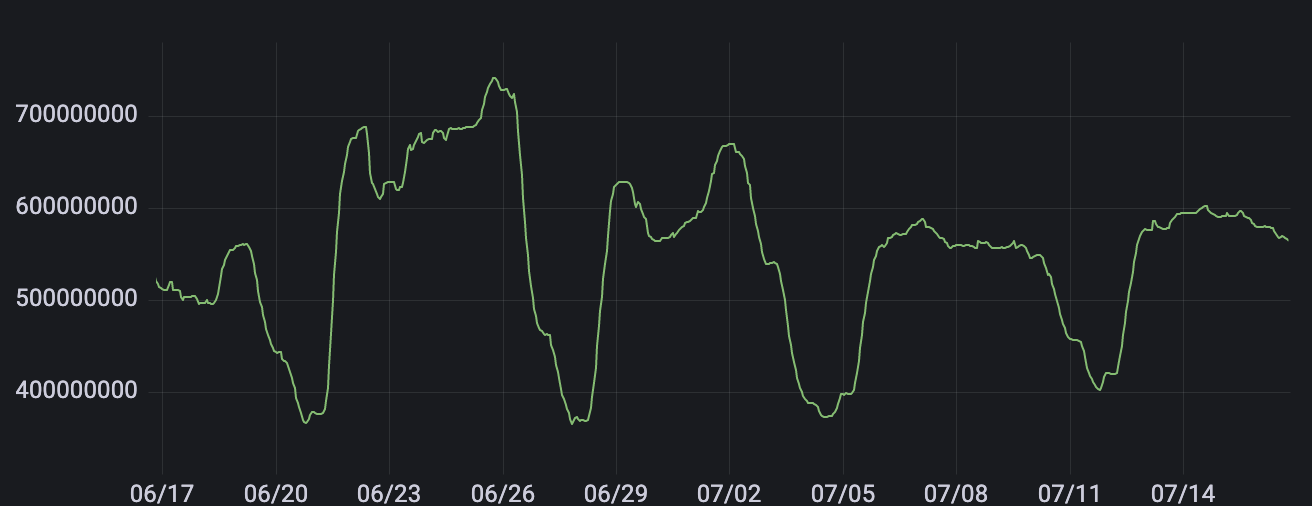
The graph is plotted in hourly dots, which shows a pretty rich graph for a month time. If we set the interval (Grafana -> Query options) to one day it will look like so:
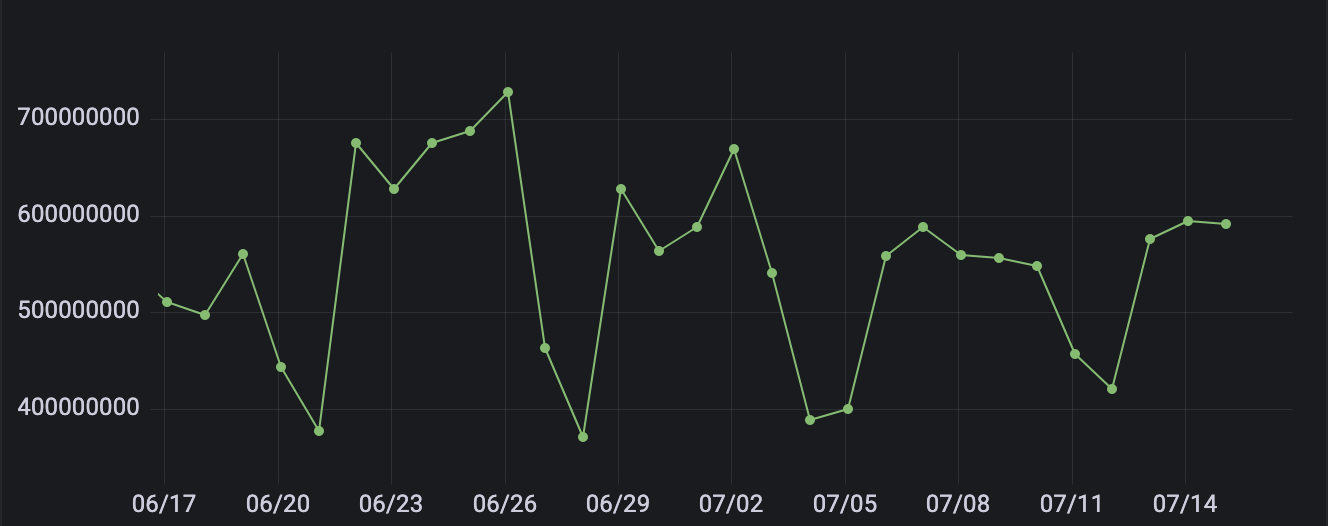
And now we clearly see the datapoints we are using to plot.
We can't really use the the interval for our monthly reports. One could try to set the interval to 30d, the time to 30d and you'll end up with weird things that do not really do what you want. The interval / resolution tells us more about 'granularity' of our data. Not in what window. It's important to understand the difference between a time vector IN your query and the time range for your visualization.
So what we want is to set the timeshift. This allows us to... shift in time. We could also use relative time, but this is often relative of 'now'. As the 'now' changes over time, this becomes a bit tricky for 'reporting of previous month'.
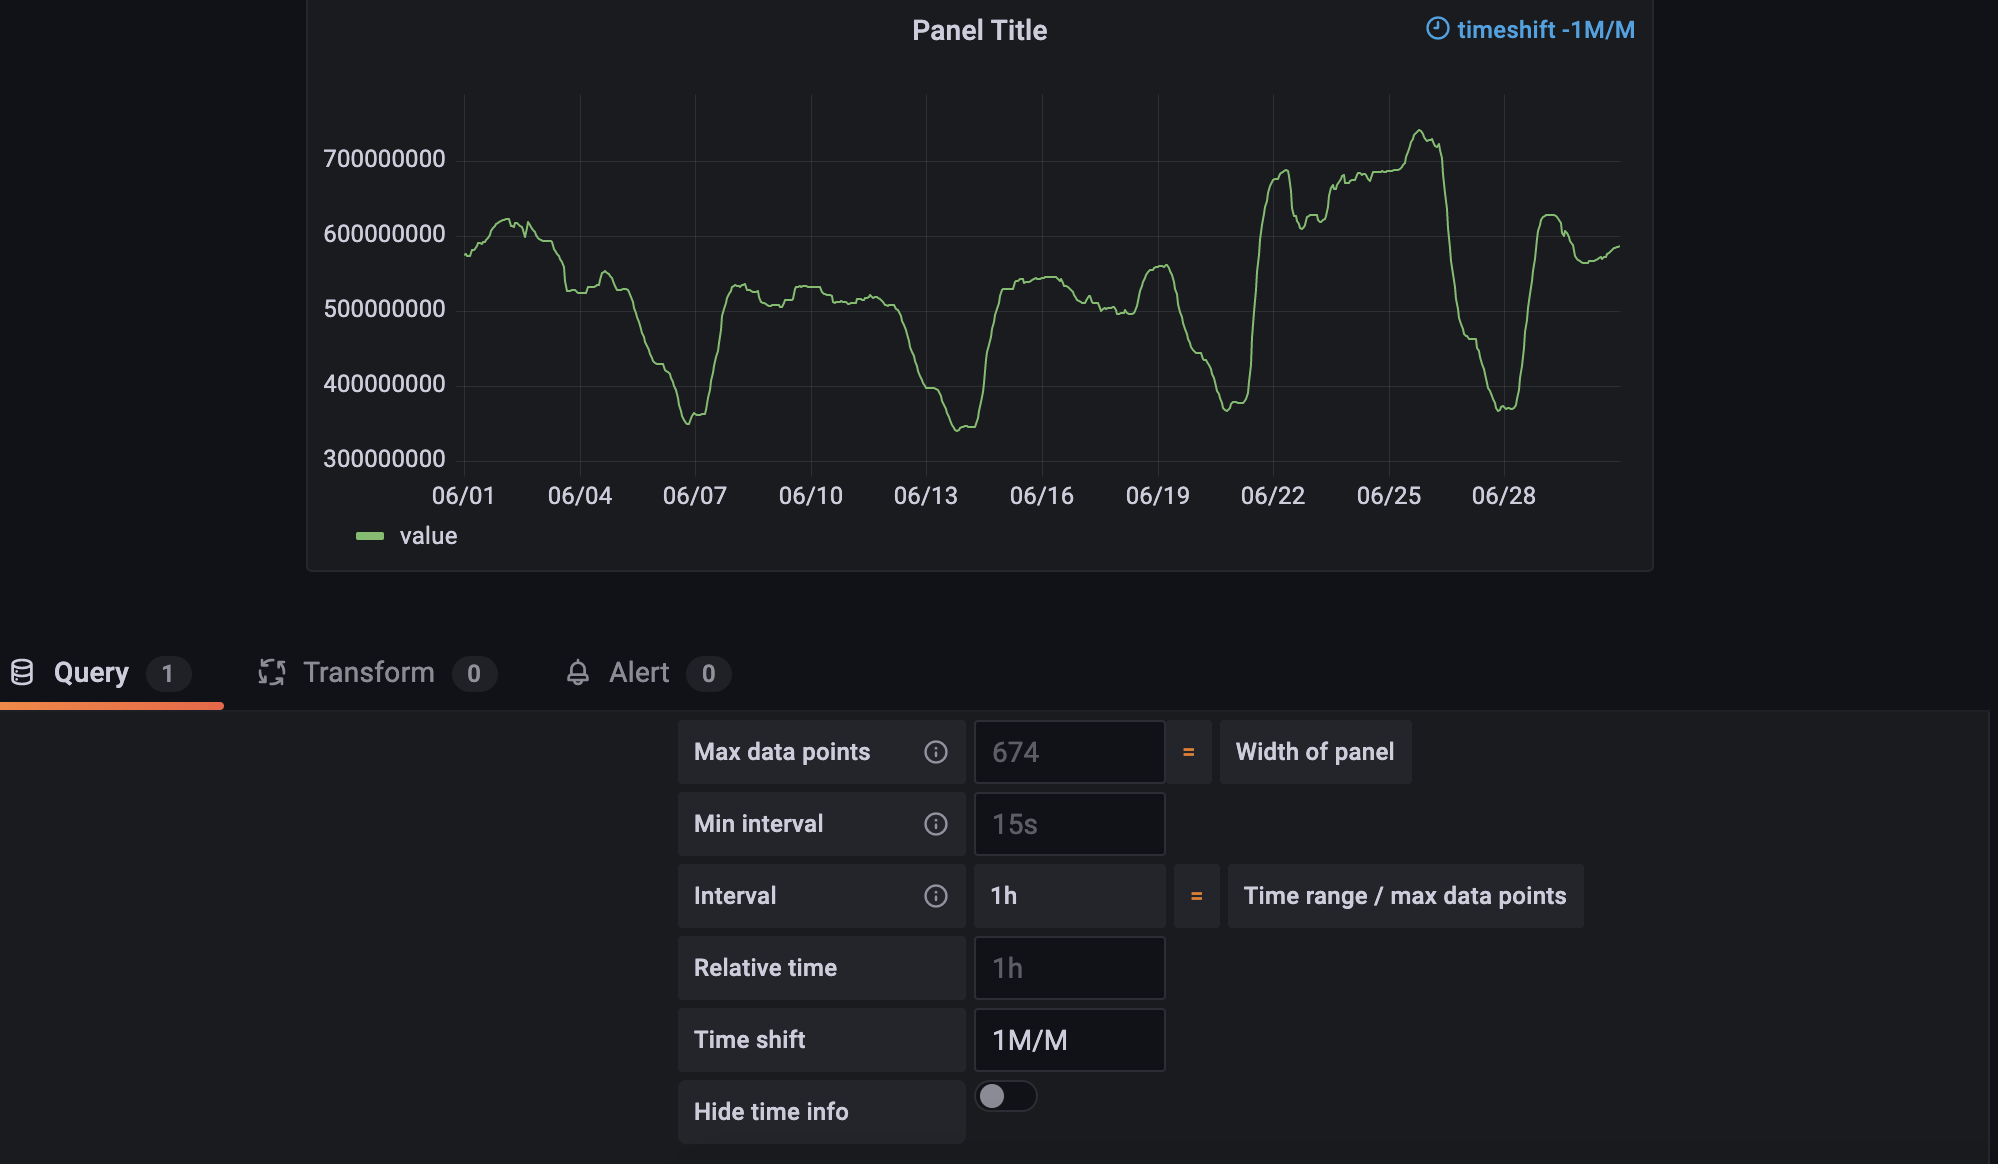
And now we have a graph of previous month. However we are not done yet. Let's extend our query to sum by (svc):
1sum(increase(jaeger_collector_spans_received_total{job="jaeger-something"}[1d])) by (svc)
And let's select the bar gauge. Voila, our data is 'bad' again.
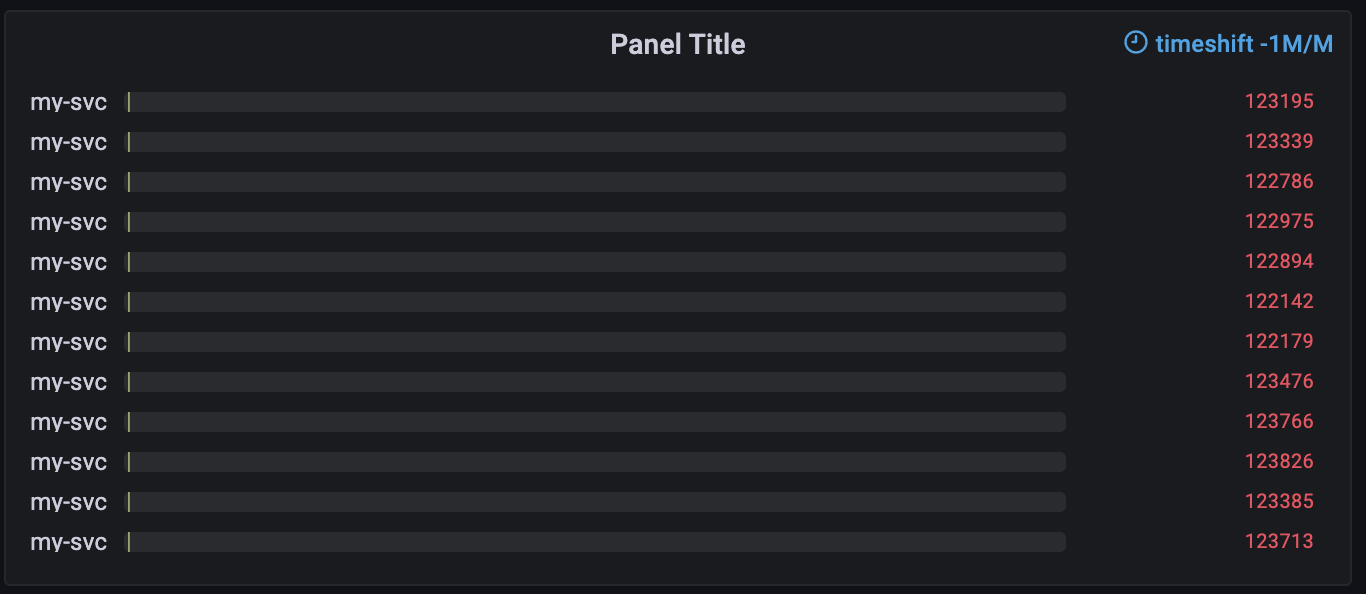
This is because each data point is not a total value. Remember our table? This is basically our table form in a bar gauge. We could fix this by setting the value Calculate a single value per column or series or show each row from All values to Calculate. However doing this removes our ability to sort the data.
Sorting multiple series in Grafana
The "problem" is we have multiple series and Grafana is doing a 'Total' sum over it. Normally one could sort their data with the Prometheus functions sort and sort_desc. This would work, but as Grafana does the Total count, it basically is still not sorted.
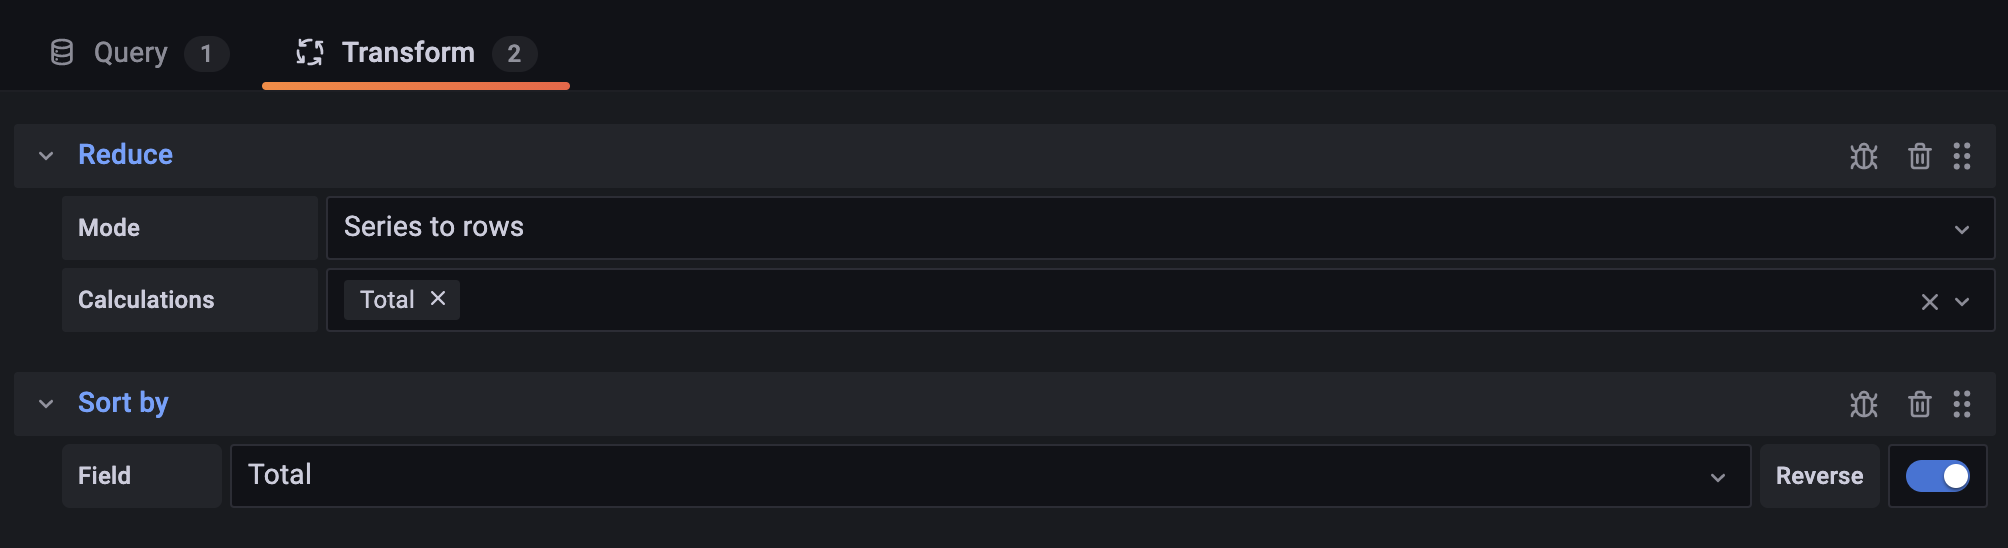
So instead of using the function in the bar gauge panel option, let's apply Transformations. The first one is to 'reduce' from series to rows and use a calculation of Total.
Next we can add another transformation, Sort by, which the value Total. We can use reverse to implement a desc sort.
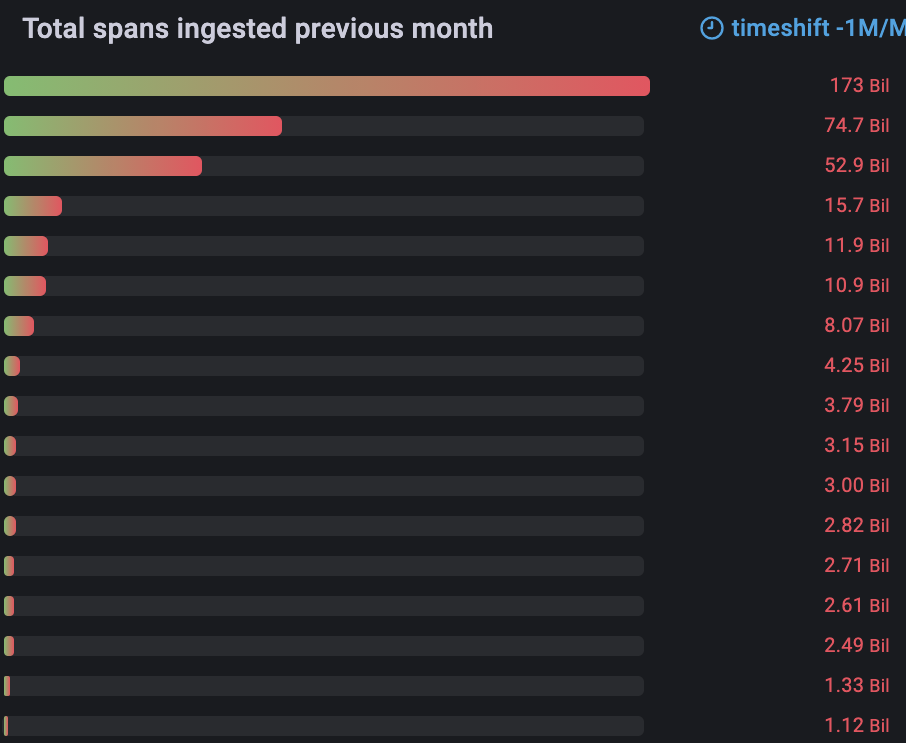
Add some fancy colors, naming, and you are done!
Things to keep in mind
While nowadays there is a lot possible, it would often make sense to create recording rules to 'prepare' your data for ease of use. Sometimes it's better to change the way we think about data and metrics. Define proper SLI/SLA/SLO's that can be measured in the first place. If not, work towards the capability to meassure and visualize it correctly. That said; we can still do a lot with Grafana and it's transformations!