Let's talk about uptime for the year 2021
Often "uptime" is an important factor in KPI's and management is a great fan of "my uptime is 99.9%". This blog post is about why the Wikipedia entry on uptime is irrelevant for modern systems in 2021 and how you can leverage metrics to a useful meaning.
Let's start with a quote from Wikipedia on uptime:
"Uptime is a measure of system reliability, expressed as the percentage of time a machine, typically a computer, has been working and available. Uptime is the opposite of downtime.It is often used as a measure of computer operating system reliability or stability, in that this time represents the time a computer can be left unattended without crashing, or needing to be rebooted for administrative or maintenance purposes."
The old days were easier. One simple server. It was either up or down and so was your service. Regardless of other factors, the uptime of a server was a pretty solid indicator which you basically could correlate to whatever you were running.
Things have changed. Not only are people keener on availability, they demand a smooth service. Factors such as latency and usability are now much more relevant. Over the past years, applications and services have evolved to keep up with demand. Sure, they are still options to have a simple HTTP website, but often things got complex. Real fast.
A default Ubuntu VPS with apache and some 'Yolo' FTP uploads might have been replaced by microservices. Or a fancier setup of the application that can follow the 12-factor principle and enables load balancers and automatic failovers. That simple website might now be running via a backend on 3 availability zones, with its frontend cached on multiple edge locations around the world.
The relevance of 'some server' not 'being up', is almost nihil. This brings us to the following:
Why uptime is a moo-point

For the sake of simplicity, let's assume we are running a website. We also assume that I worked on a fancy observability platform and a user of this platform asks me: "I want to see my uptime".
What I might say is: "Well, the homepage is reachable via my machine. So it's 100%, right now, for me".
I get called a smart-ass, but actually, I have given an answer based on a question that cannot be answered. I had to define my own set of rules, and these rules are so important. Because apparently, you can be a smart-ass if you don't define them correctly.
You will need to think about a few things:
- What do I want to measure
- How do I measure this
- Time; What is the time-window, how often do I measure, how relative in time is my question
For a website, it might be possible that the server is reachable but the webpage is not. So even the uptime of the server itself is irrelevant if it's not serving any content. We can opt for doing HTTP requests and see if the page actually loads (and perhaps gives the right content). If we do HTTP requests we might just add in the 'TTFB' (time to first byte), the total load time, and the HTTP response header. Let's do this every minute from a second server.
Now it's important to realize what we can assume of this data. I check these metrics every 60 seconds. It's now possible, however somewhat unlikely, that the metrics for the other 59 seconds are completely different. I'm not saying you should 'scrape' these metrics every second. I'm just merely stating that if you have 100k requests/minute that your single scrape provides a very, very rough estimation of what is going on. I'm checking these metrics from a second server, but it's in the same datacenter. We may take some short-cuts here regarding routings, DNS, and some other factors. I mean, it could be possible that nearly the entire world can't visit the website, but I can. I'm only doing this for the homepage. For all I know, this is the only page available and everything else is not working.
Now with these factors in mind, I often see people/teams/organizations say: our uptime was 100% this month. The cake was eaten, the champagne bottle popped.
What now if this website was a webshop. It had that fancy 100% uptime everyone was so happy about. Yet what if I told you that 90% of your customers experienced bad loading times. 15% of the sales were canceled due to a payment issue. 5% of the products that you wanted to sell were out of stock on the website, even though it was not. You paid 10k worth of ads on a page that did not exist. There were multiple outages ad-random for 1-2 seconds. Customers' sessions got reset every 5 minutes, losing their cart items.
Bet you wished you did not throw that "we've got 100% uptime" party.
Towards observability
Increasingly complex (distributed infrastructure) systems and customer/user demands require something more than just system monitoring. I could dedicate an entire blog post on observability, but perhaps that's for another day. However, I will use certain aspects of observability to give pointers on what we want to achieve.
Observability often consists of the three pillars; metrics, logging, and tracing. I'm going to focus a bit on metrics as this is the most relevant for the contents of this post. It's the entry-level towards observability and it can provide a general overview.
We generate metrics, which can come in various types.
- Counter: for values that only go up. For example the number of processed requests
- Gauge: for values that can go up and down. For example the number of visitors on your website.
- The histogram and summary type. Both look roughly the same. They 'observe' requests and create different 'buckets' with values, the total sum of all observed values, and the count of events that have been observed. The summary does buckets based on quantiles while the histogram can use your defined buckets.
Often we use Prometheus to "scrape" these metrics from various systems in its time-series database. This happens at configurable intervals. We then can visualize these metrics with Grafana. To be honest the defacto standard for visualizing metrics.
We re-use our website and again just for the sake of simplicity we assume that it is just hosted on one web server. We are just going to make it fancier by working with various metrics. Metrics from the server and it's services and metrics from inside our application/website.
If we use an application such as Telegraf, we have a pretty easy base-line creating metrics from our server. Think about CPU/memory/disk usages but also some network information. We can extend this by including metrics from, let's say NGINX and PHP. The services our website uses.
In our application, we add more metrics. We can add metrics regarding processed requests on various endpoints. Perhaps include the latency for these requests. We should use other pillars in observability. For instance, logging on errors for a better understanding of the 'why'. Tracing to go even deeper, especially if your application hits multiple other services that might be relevant. But, let's ignore that for now.
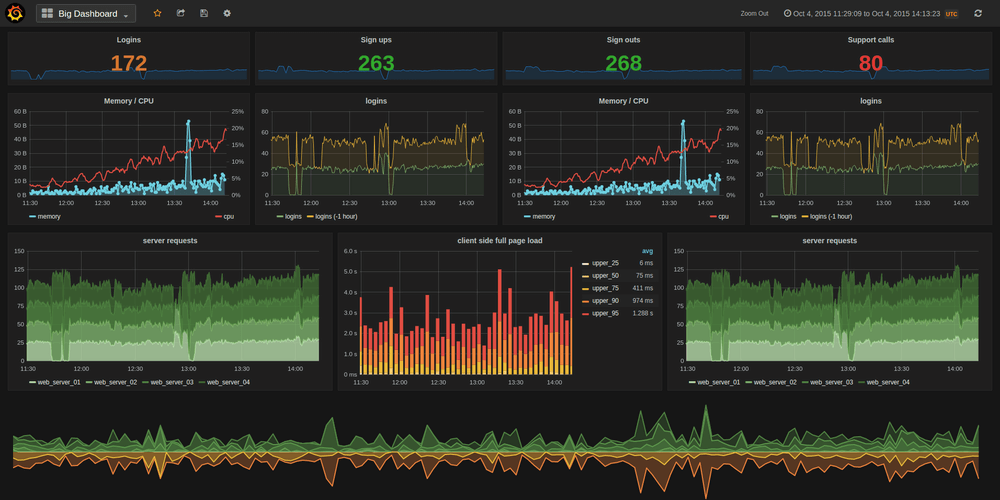
An example of a NGINX dashboard - credits to Anton Shevtsov
By default, Prometheus has a metric called "up". Often it is used to calculate the uptime of the entire server. Yet we should understand the metric. The metric is either 0 or 1. It's whether Prometheus can scrape your metrics. A successful scrape is a 1. So basically, if you want to use this to see if your entire server is up/down. You can't, factually. It's really important to understand that this only tells you that Prometheus was unable to scrape the target. It might have been a timeout, a network issue, or a DNS resolution failure. This is why it's important to think about your data, metrics, and behavior.
Nonetheless, we have provided ourselves with a lot more information. We in general know how the system is performing, we have better insights on specific levels about what is going on. We can now have a general understand of if our system is available, serving requests, and how the internal performance is.
Going from "uptime" to metrics
And this I cannot stress enough, its, really, really hard to change your mindset from "something is up or down" towards observing your stack. With my previous segment going towards observability I tried to explain that we combine various "inputs/outputs" to get an understanding of what is going on. However, this will be a path in which we have to think a lot more about what we want and want to achieve.
We have a higher cardinality in our data. So it's simply harder to ask simple questions that provide simple answers. Yet when we do interpret our data properly we gain so much more back.
So, how to use these metrics?
If you have worked with message systems, you already know that the question: "How do we guarantee all messages are processed?" is quite a tough one. In my opinion, it's the same for Prometheus. Not only do we have to fetch the data, but we also have to account for the "time" we did it. If I'm scraping a target and my HTTP request takes a long time to complete and hits a timeout: There is no way for me to "back in time" and try getting it again.
For this, and other reasons I won't be discussing today, we should use metrics in a way that they provide value and insights. Not in a way that we micro-manage them by having 1-second scrape intervals and 5-second alerting evaluations
I've created a simple application. It creates one metric: "myapp_processed_ops_total". It's a counter that increments every 2 seconds. I've told Prometheus to scrape my application and now I'm going to visualize this metric:
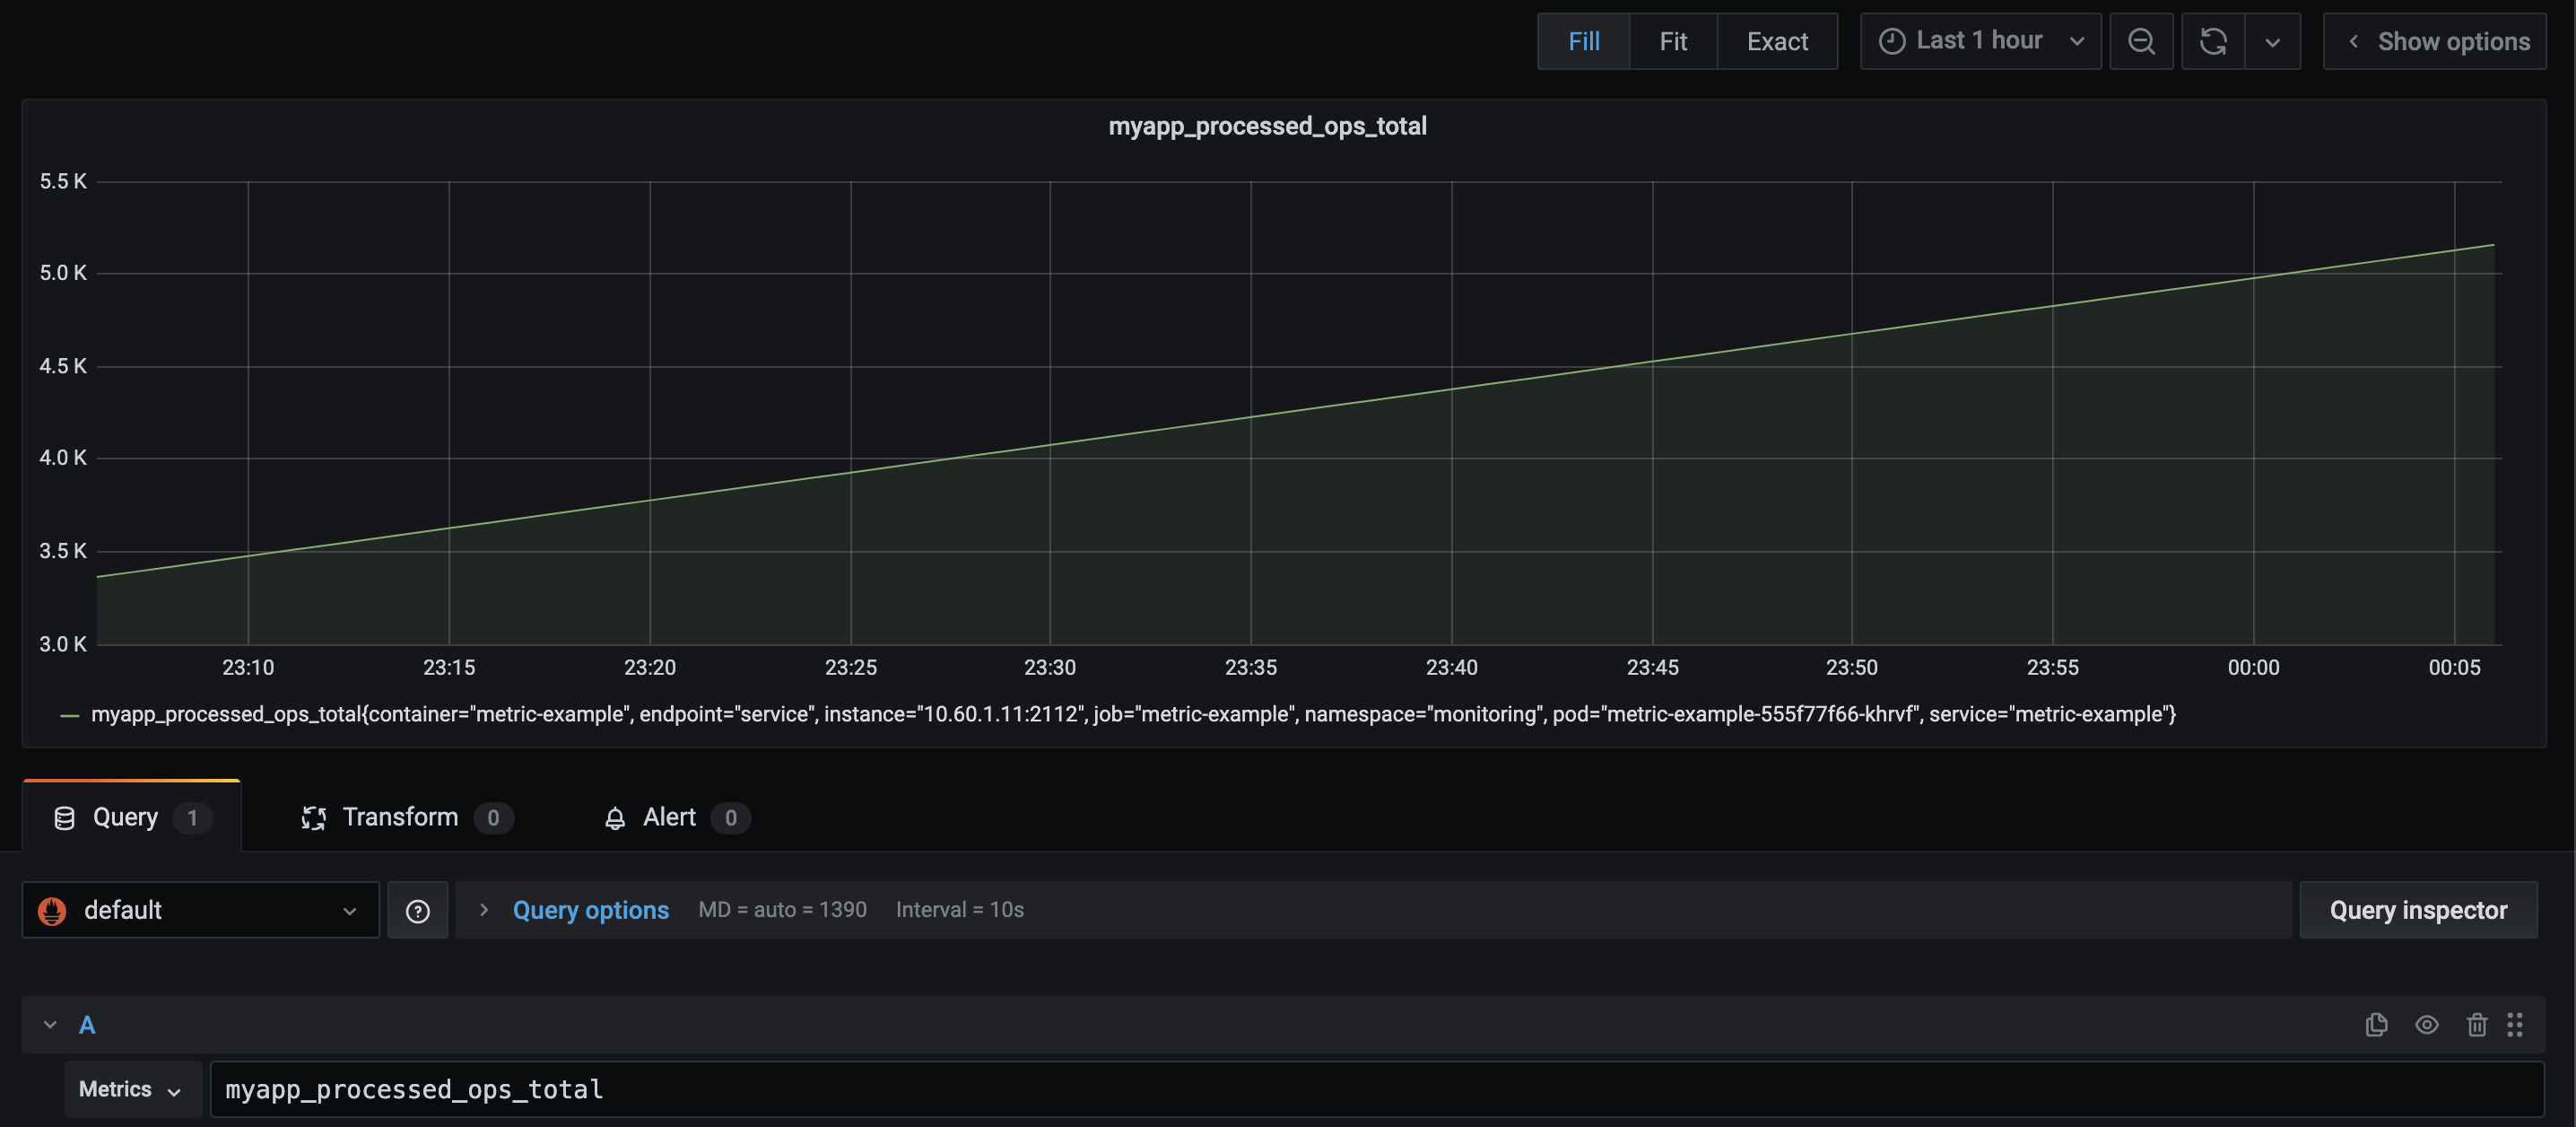
As you can see this is just a straight increment. However, it does not provide that much information to me. Sure, it's a solid line, but I've got no idea by how many it's getting incremented. When I restarted my application, it even gets reset:
We can fix this by adding a rate, which is a query function: "rate(v range-vector) calculates the per-second average rate of increase of the time series in the range vector. Breaks in monotonicity (such as counter resets due to target restarts)"
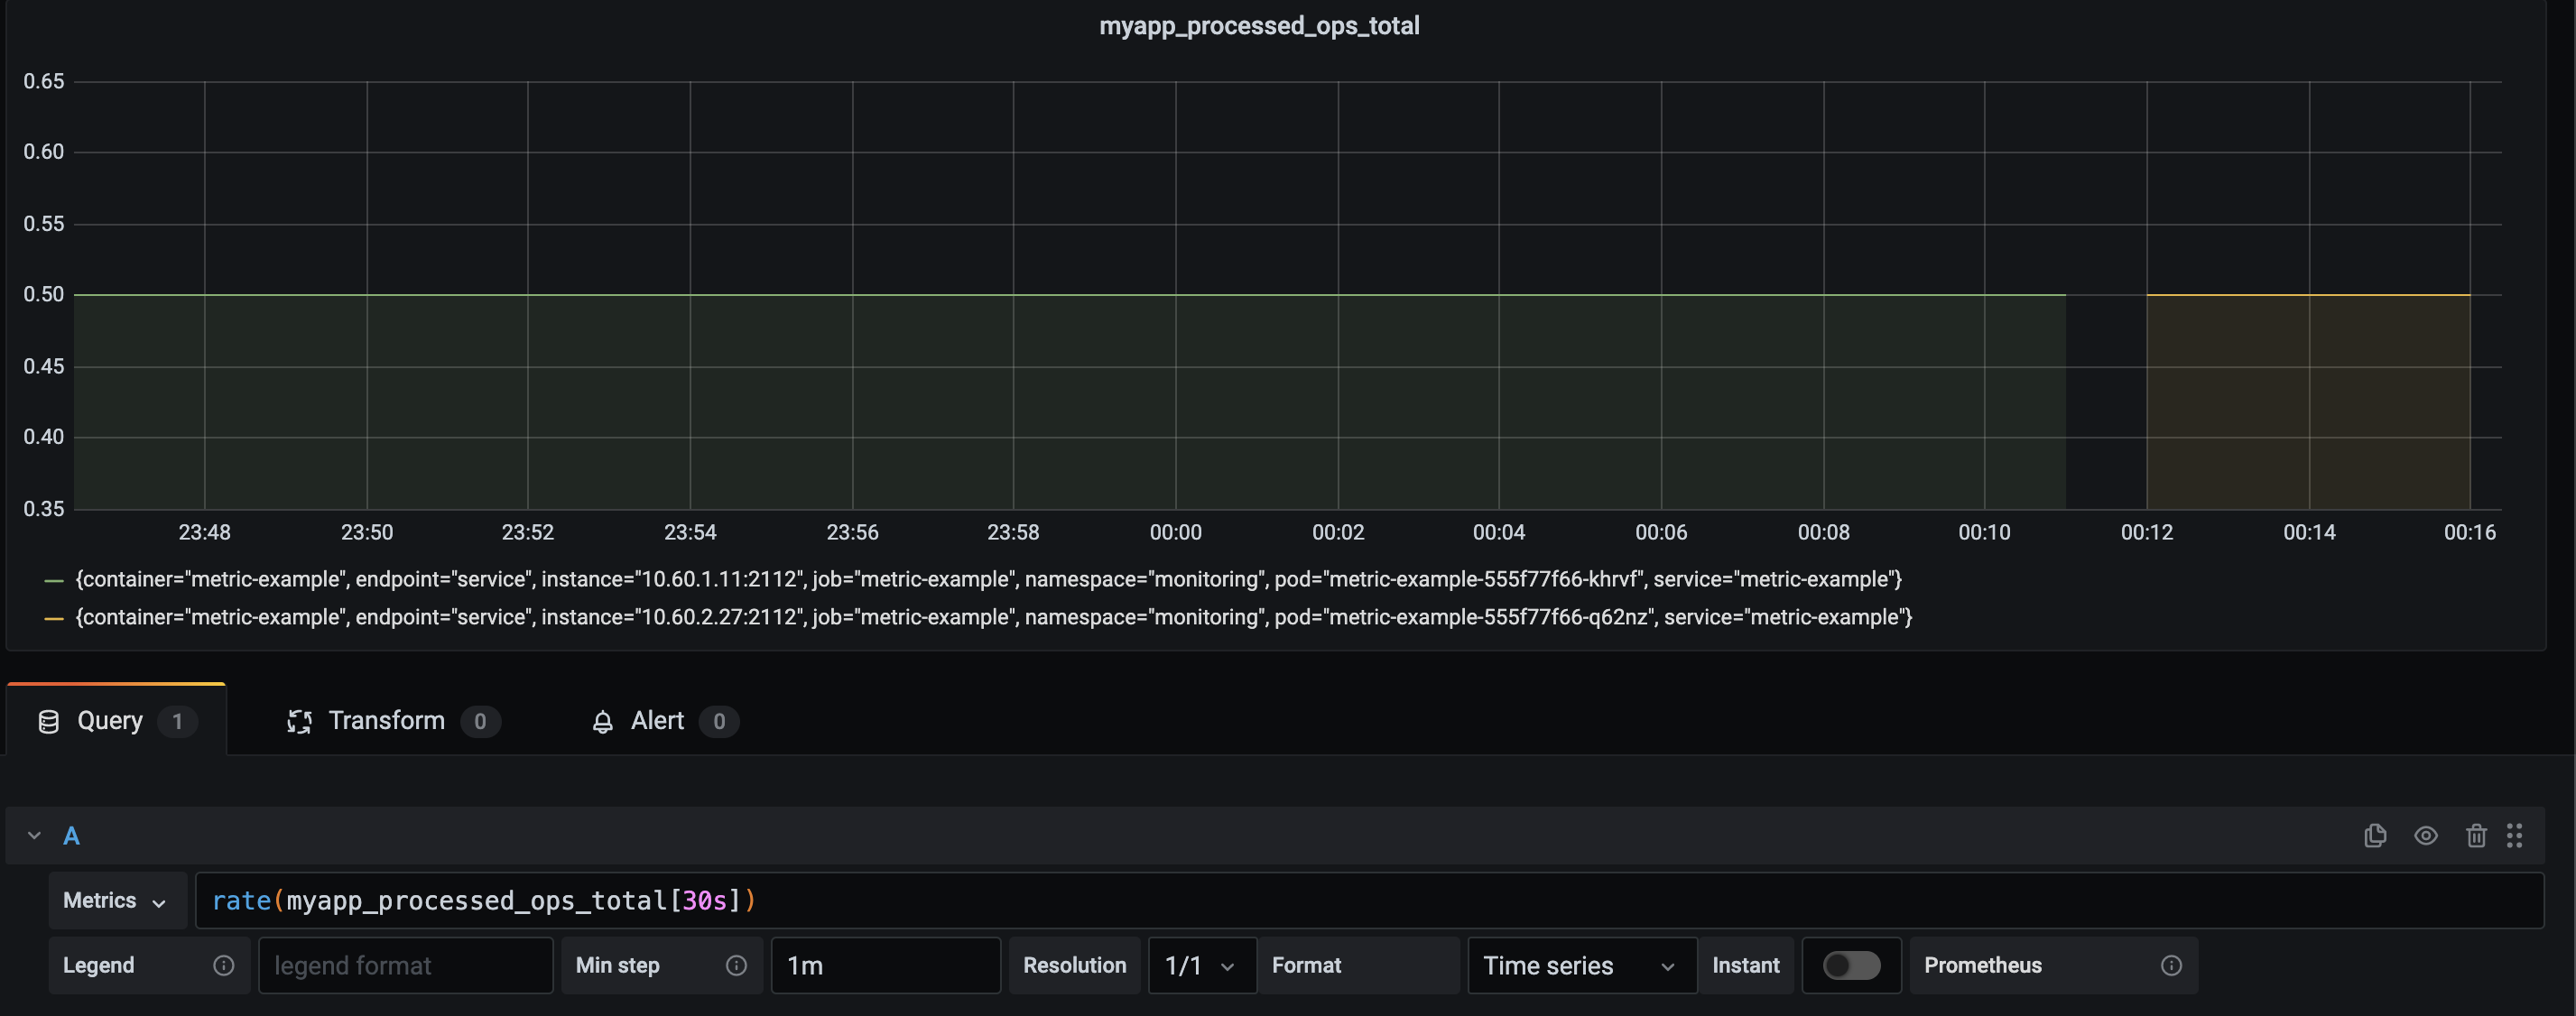
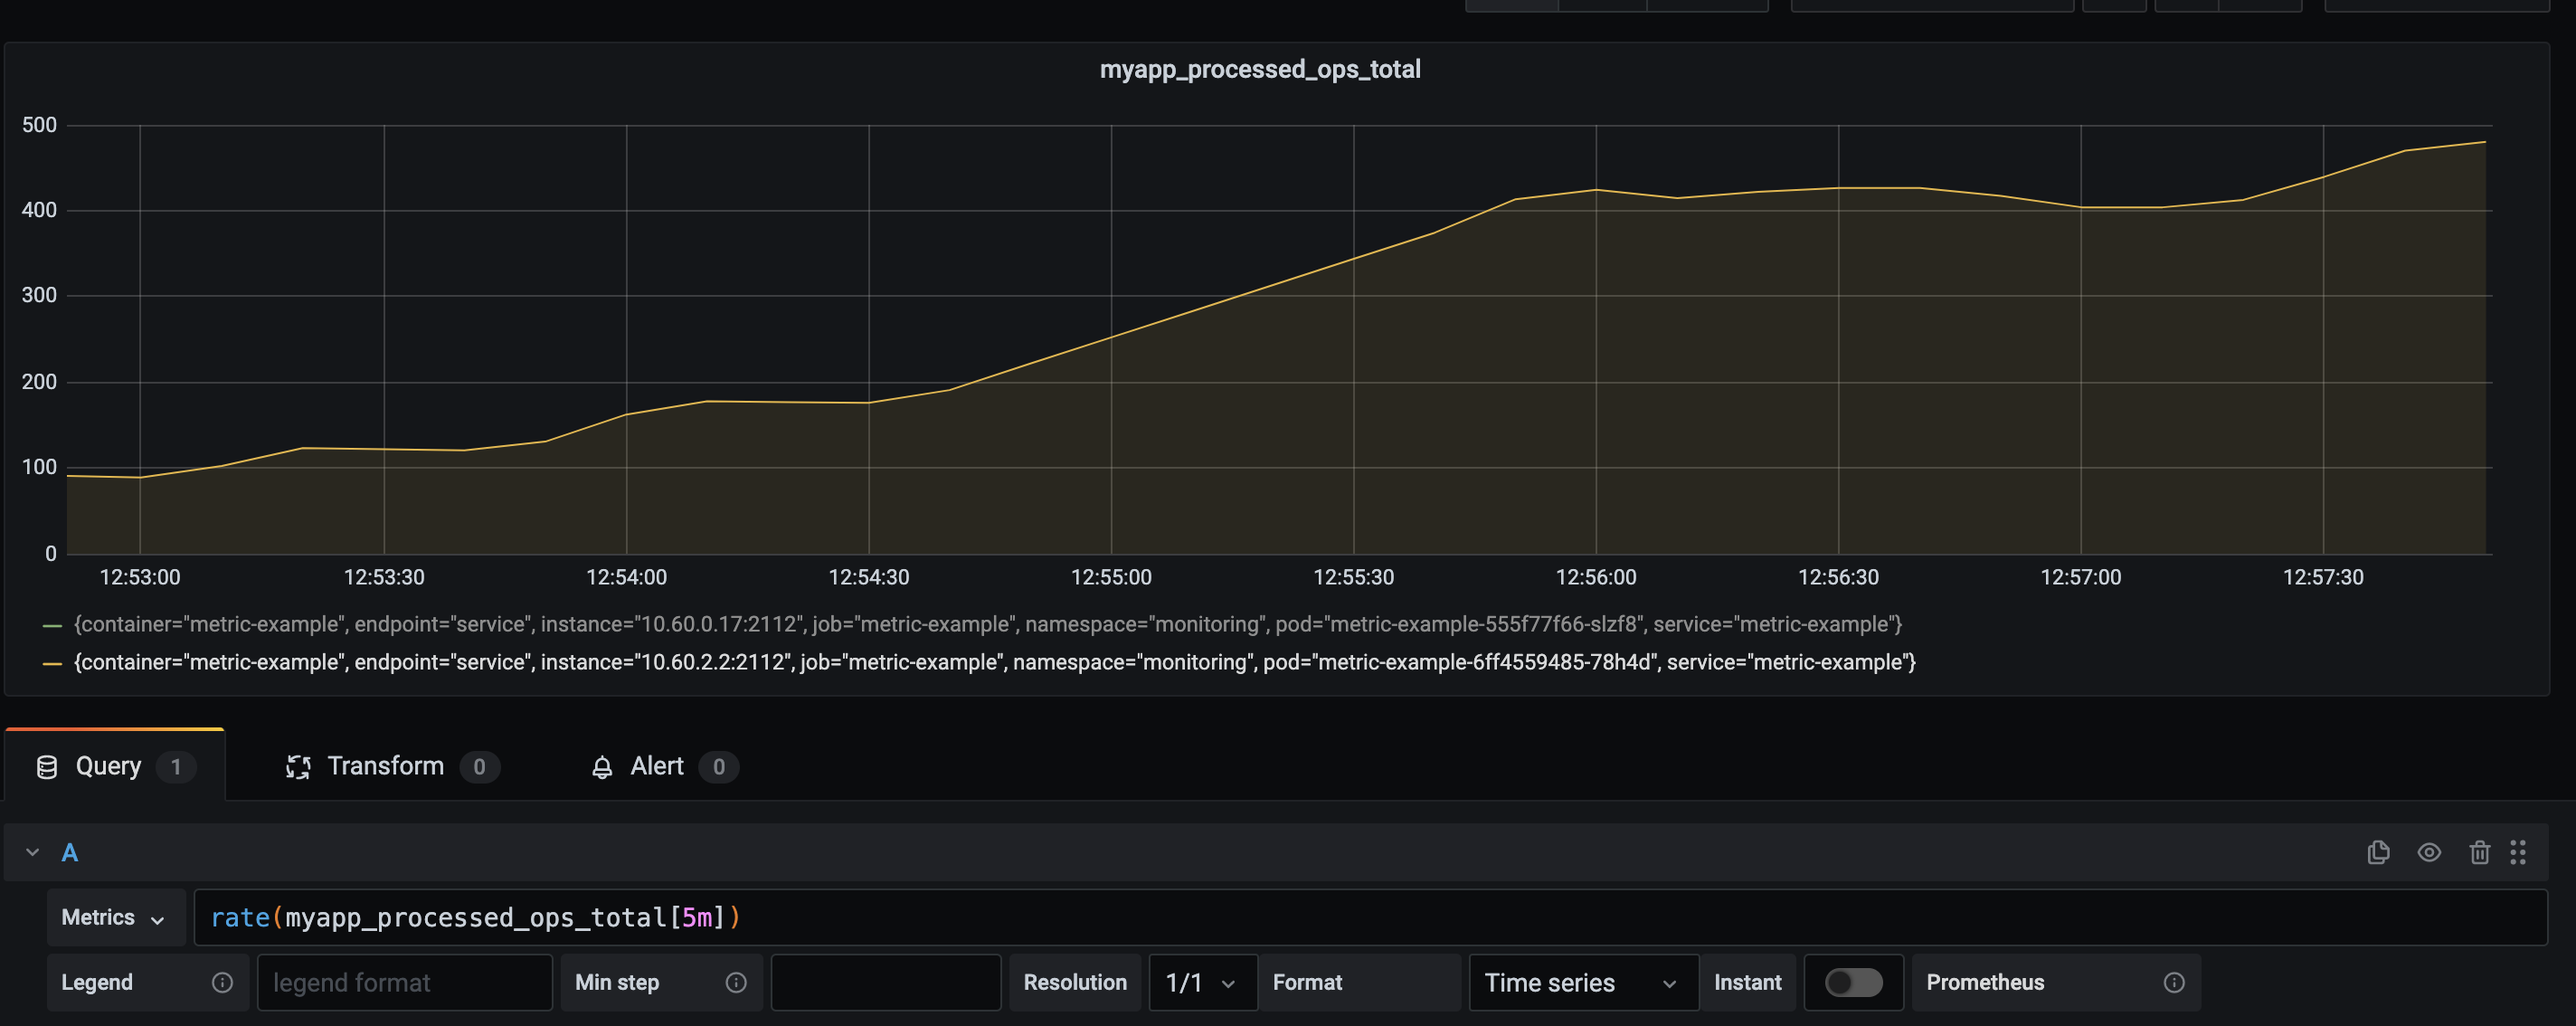
Now I've calculated the rate, in a 30-second time range. This range is quite important. To indicate why that is, here is the same data, but with a range in a 5-minute range vector:
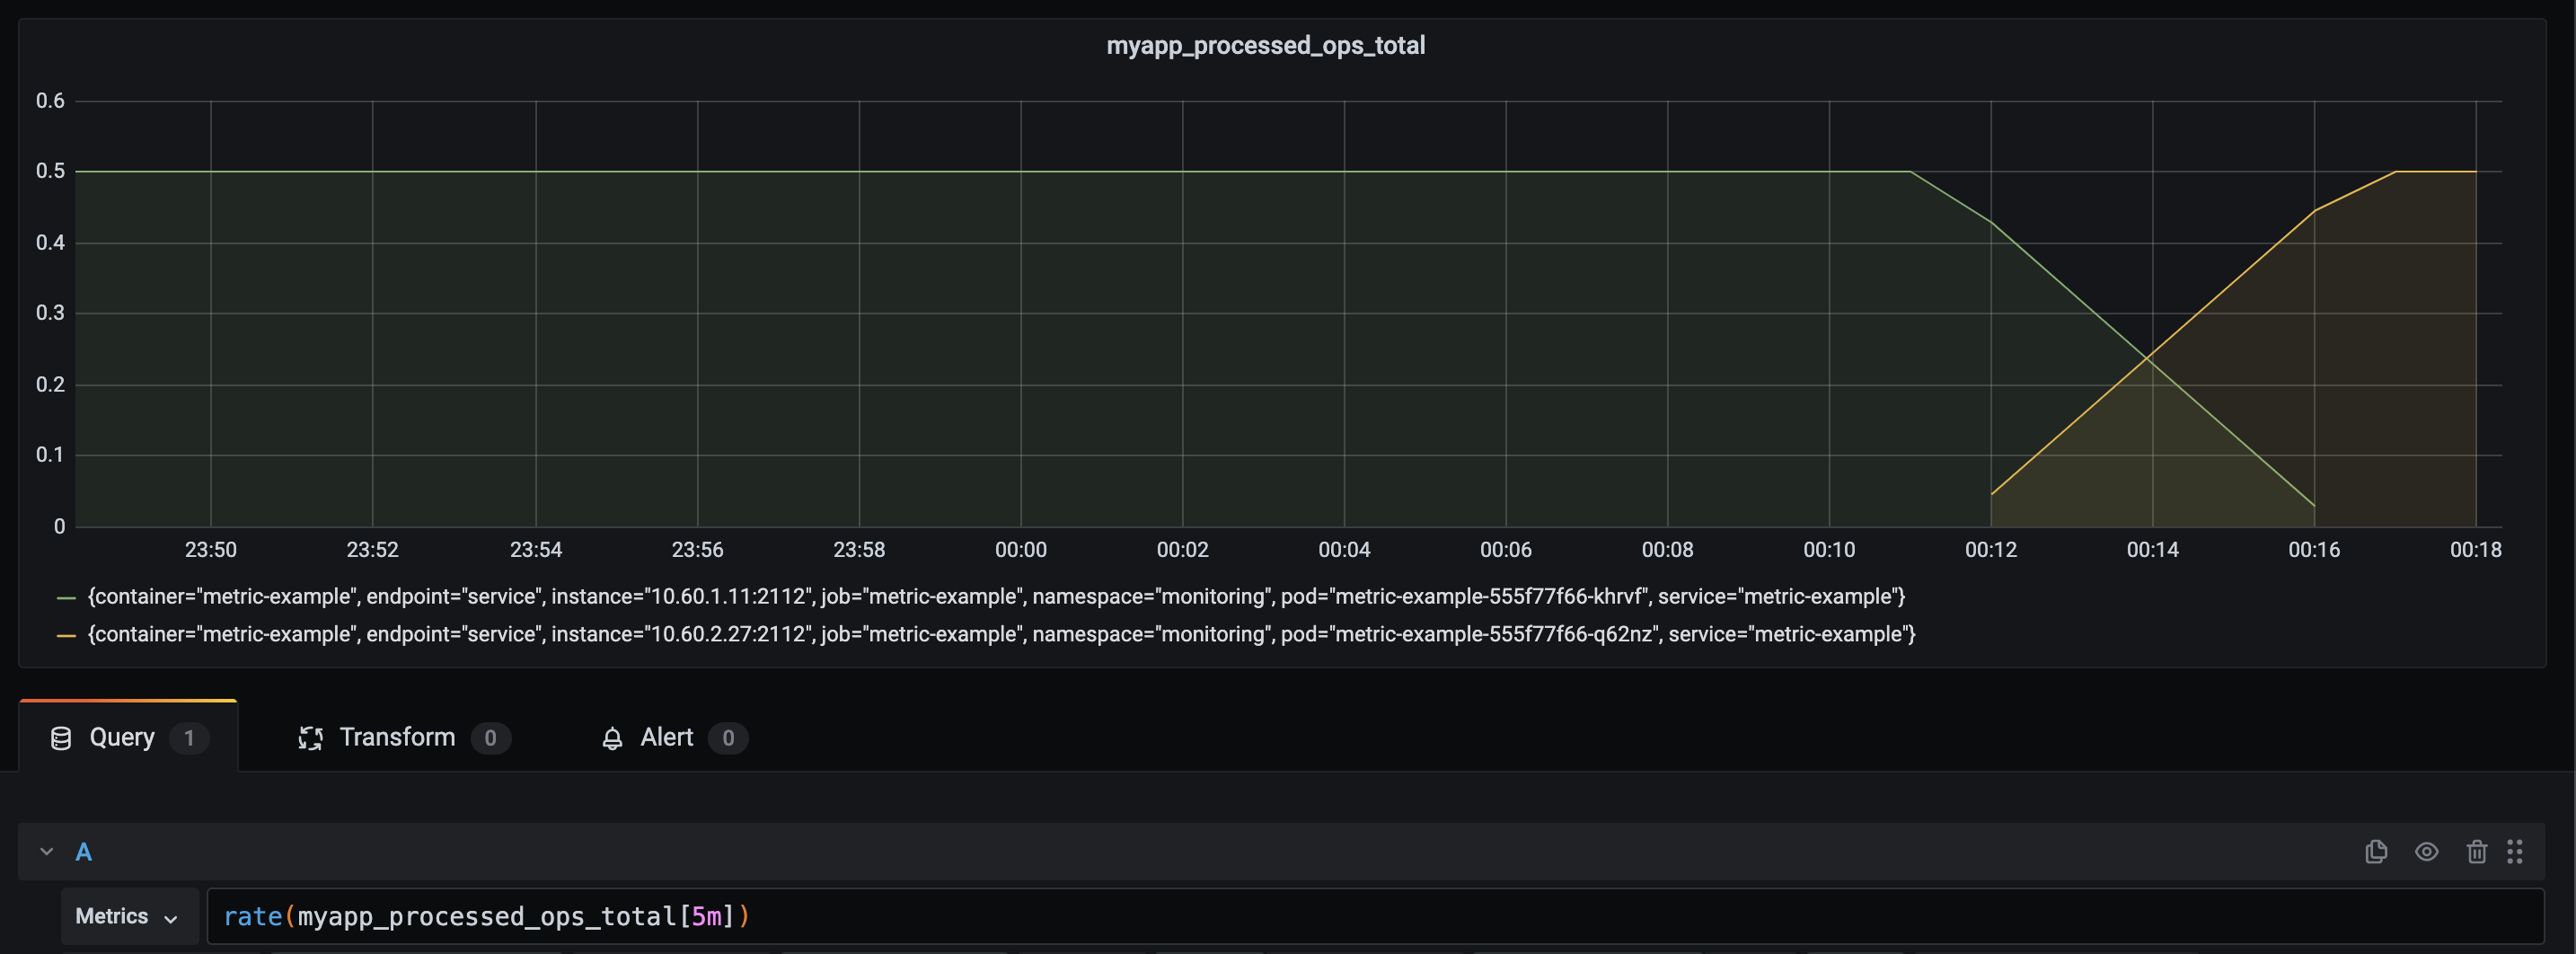
As you can see, it takes the range-vector of 5 minutes, 5 minutes to get to the exact level that we expect. The query that we use, allows us to define a question. What is the rate of metric X per second, over a 5-minute time window? Now I've caused some network issues and Prometheus was unable to scrape my service for a period.
In the ideal world, we would still have a solid line with an average of 0.5 value over 5 minutes. Especially since the rate function can "handle" a scrape failure and our application was still processing those requests.
Now I have to think about my use-case. Do I want a global insight into how many requests are being processed or do I need a guarantee that I do 1 process every 2 seconds? If it's the latter, I should not use metrics, HTTP requests to fetch those metrics, and then plot them over time. I perhaps should implement a function in my application that is precisely handling that. Then throw an error or alert if something is off. I could use metrics to count those errors. I could use logs and traces to incorporate them in one system and provide me details on how/what/when.
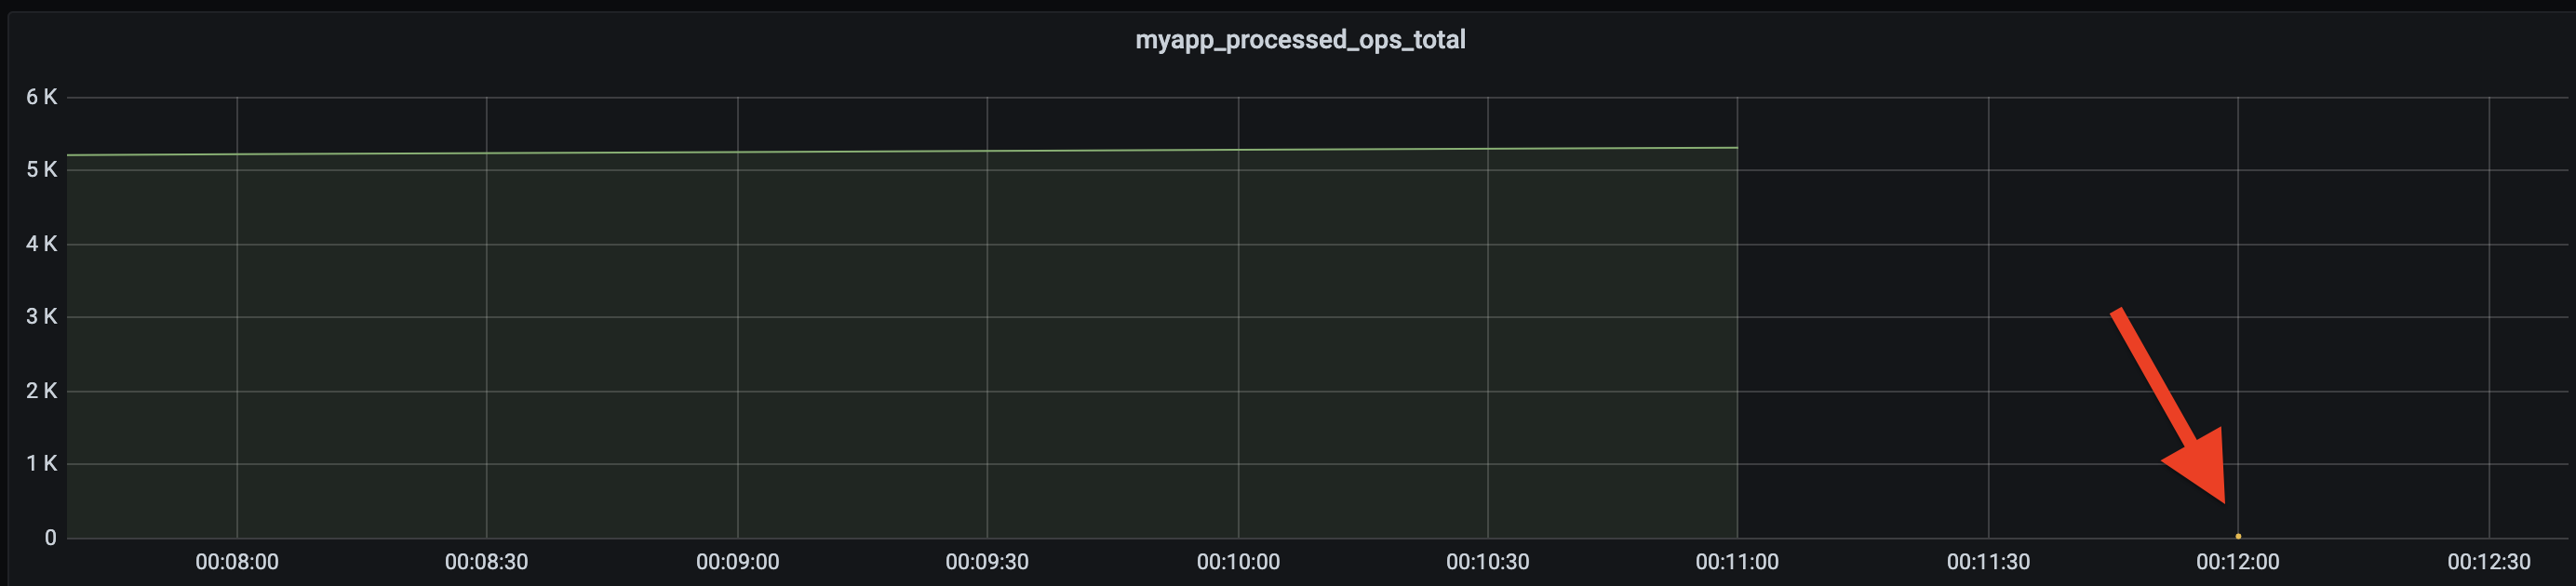
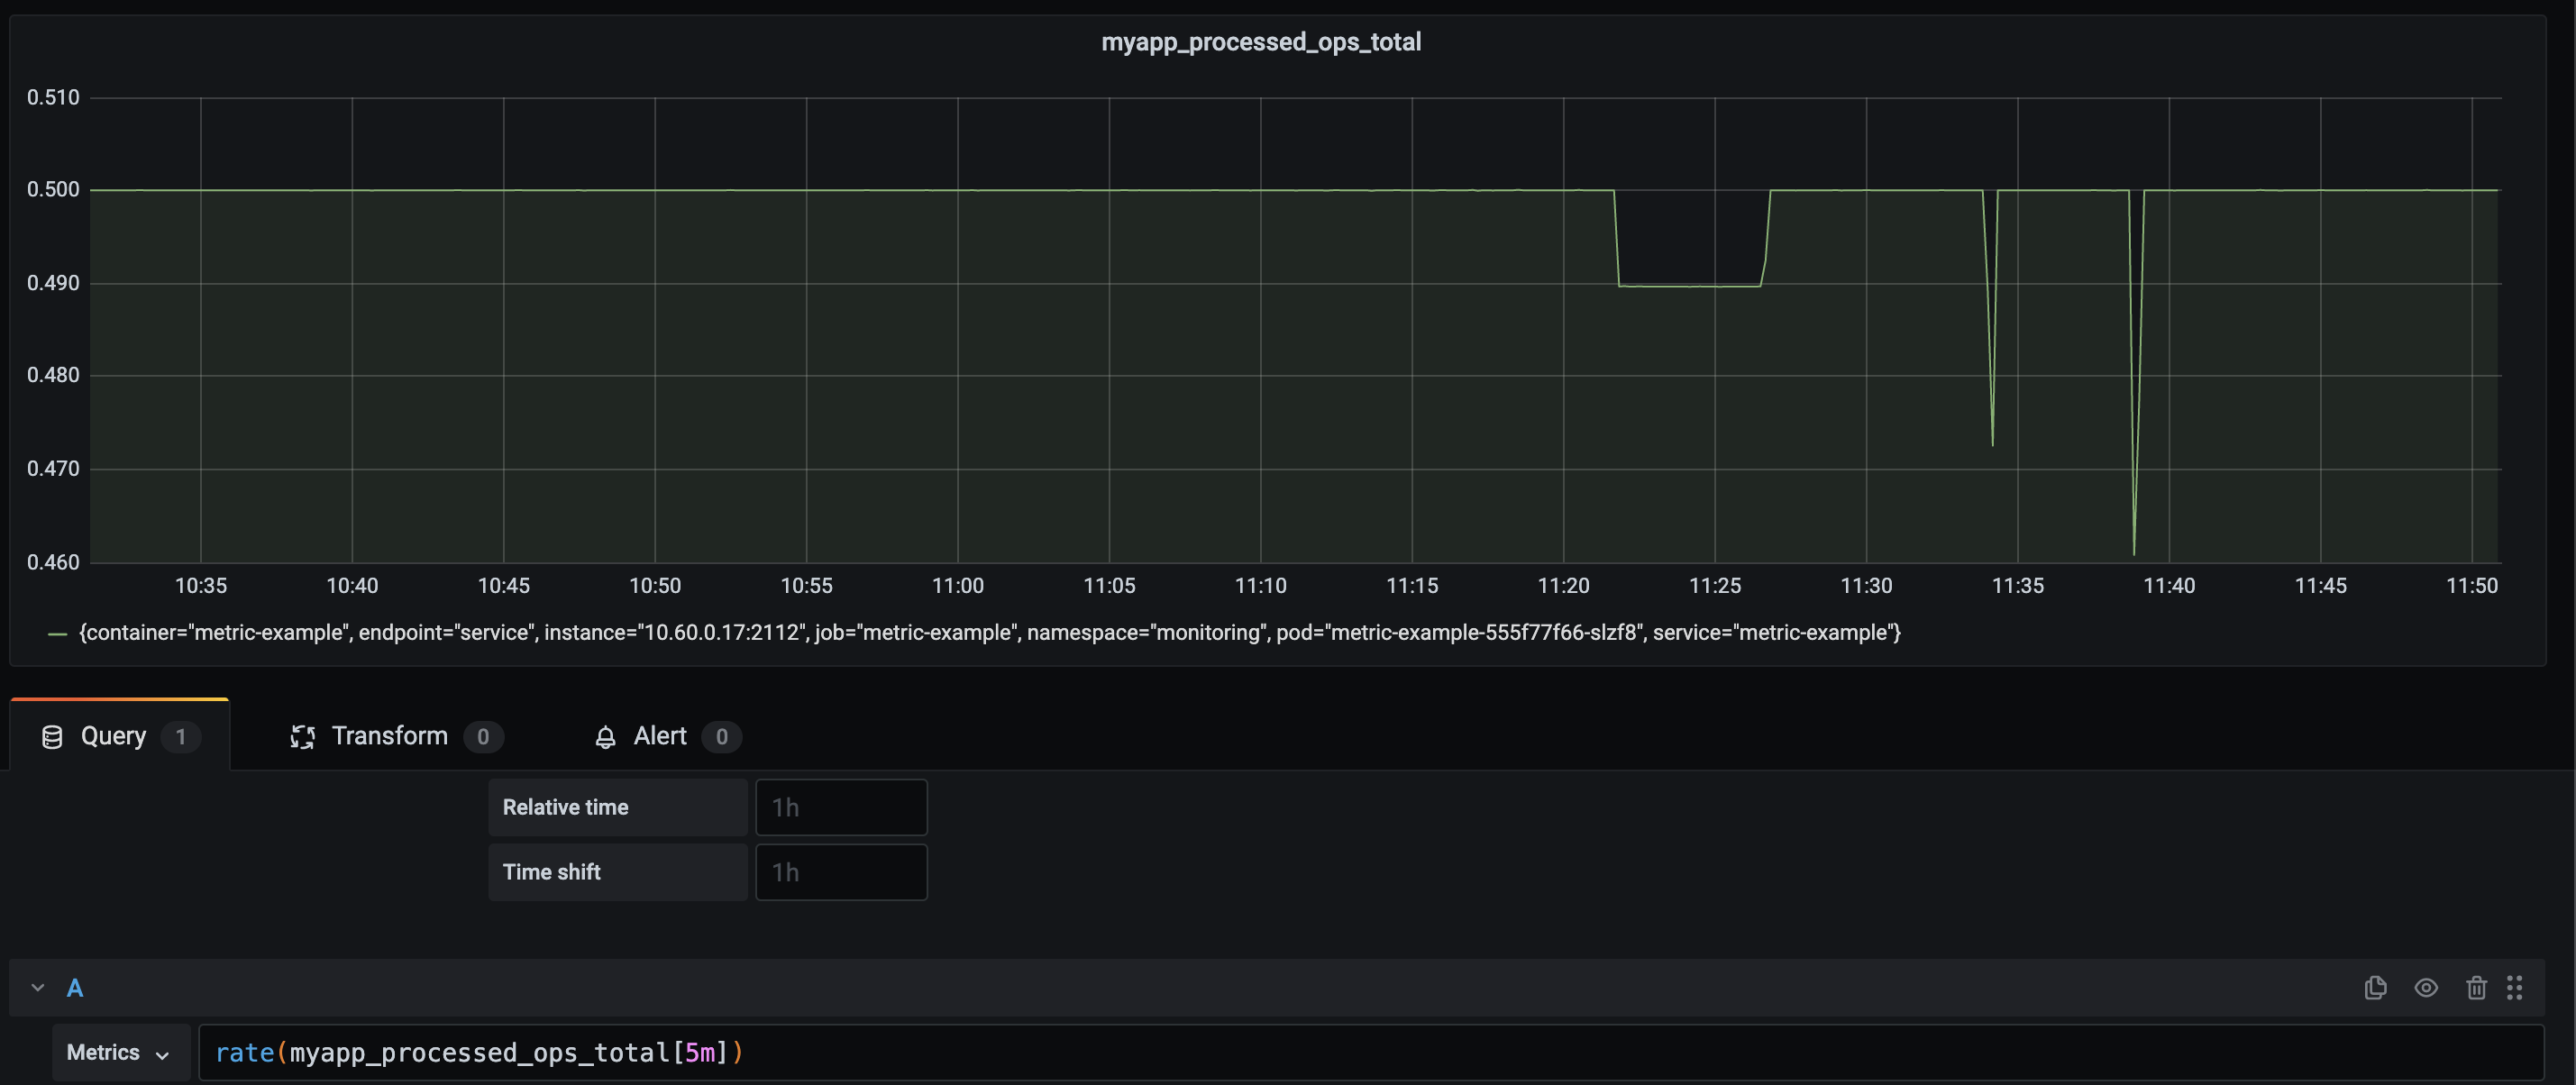
I have to use metrics in a way that provides insights, that I can account for false-positives, and is useful for what I want to achieve. Let's consider a somewhat different use-case. I try to replicate a webserver that gets a lot of requests. I've increased the amount that gets added to our counter and I've implemented "a bug". At random, it does not process any requests anymore for 30 seconds.
This is my data, with a rate of requests per second, calculated in a range of 5 minutes. Since this application "never worked" properly, we don't see an issue. It's quite a consistent line. My base-line is wrong. I never knew what I wanted to see, therefore I can't use this 5-minute range. Yet.
To explain what I mean, let me alter the range to 30 seconds.
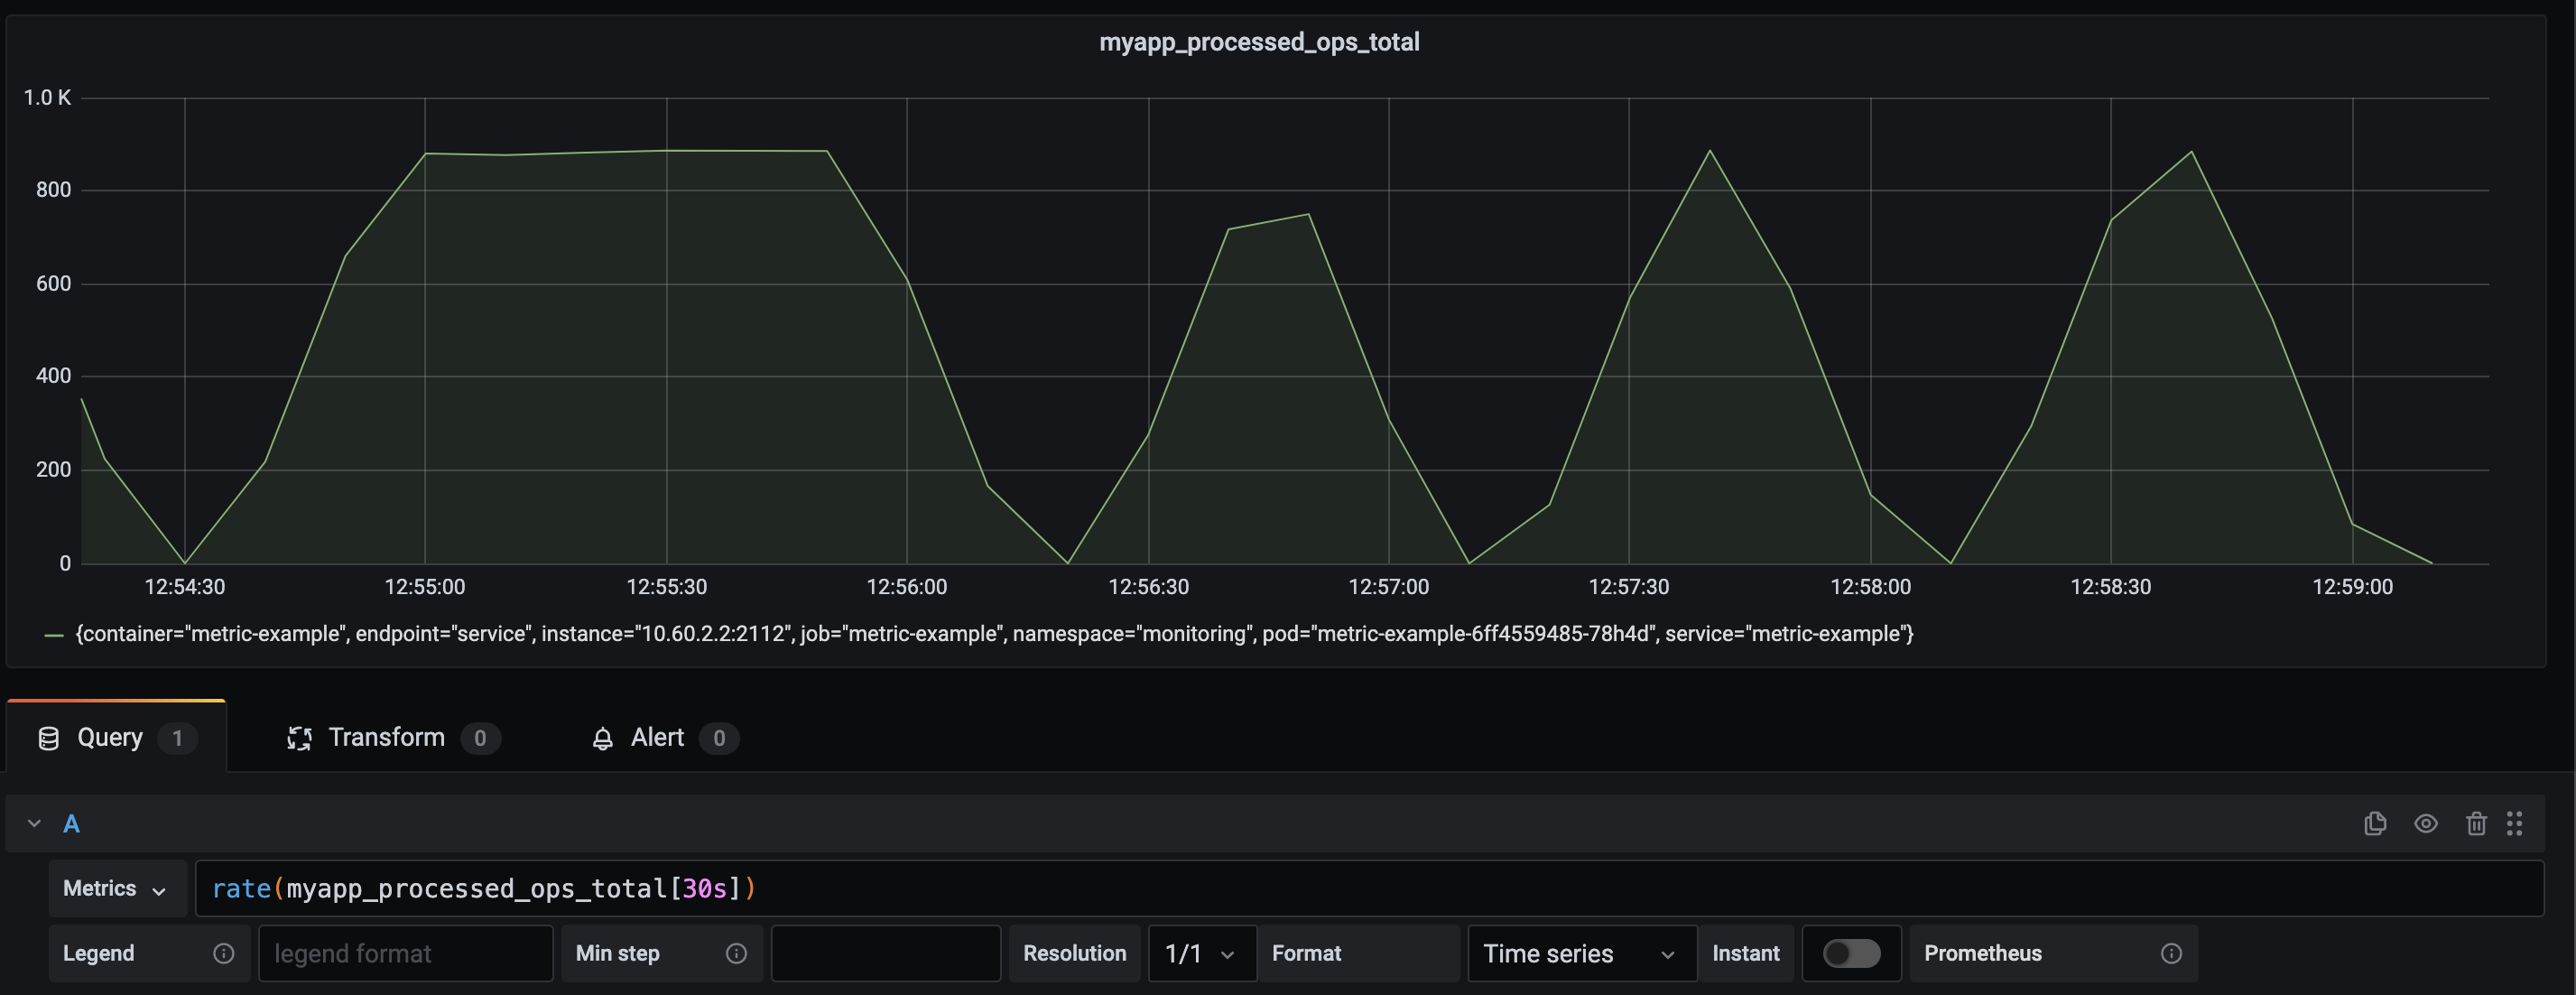
Oof. Even though I perhaps don't know my exact base-line. I do know that "0" is not correct.
It means I have to think about what I'm trying to achieve here. Perhaps it was useful if I've used a summary or a histogram and have buckets containing the observed state in perhaps quantiles. Perhaps I have to use two different dashboards / alerting rules.
One for the long term, one for the short term. Then I think about eliminating false-positives in case of a scrape failure and other factors. I prefer to only get alerts if it's something I should act on.
So, in this case, I want to know if my requests hit a certain threshold. I could make something that tells me if the value was < 1
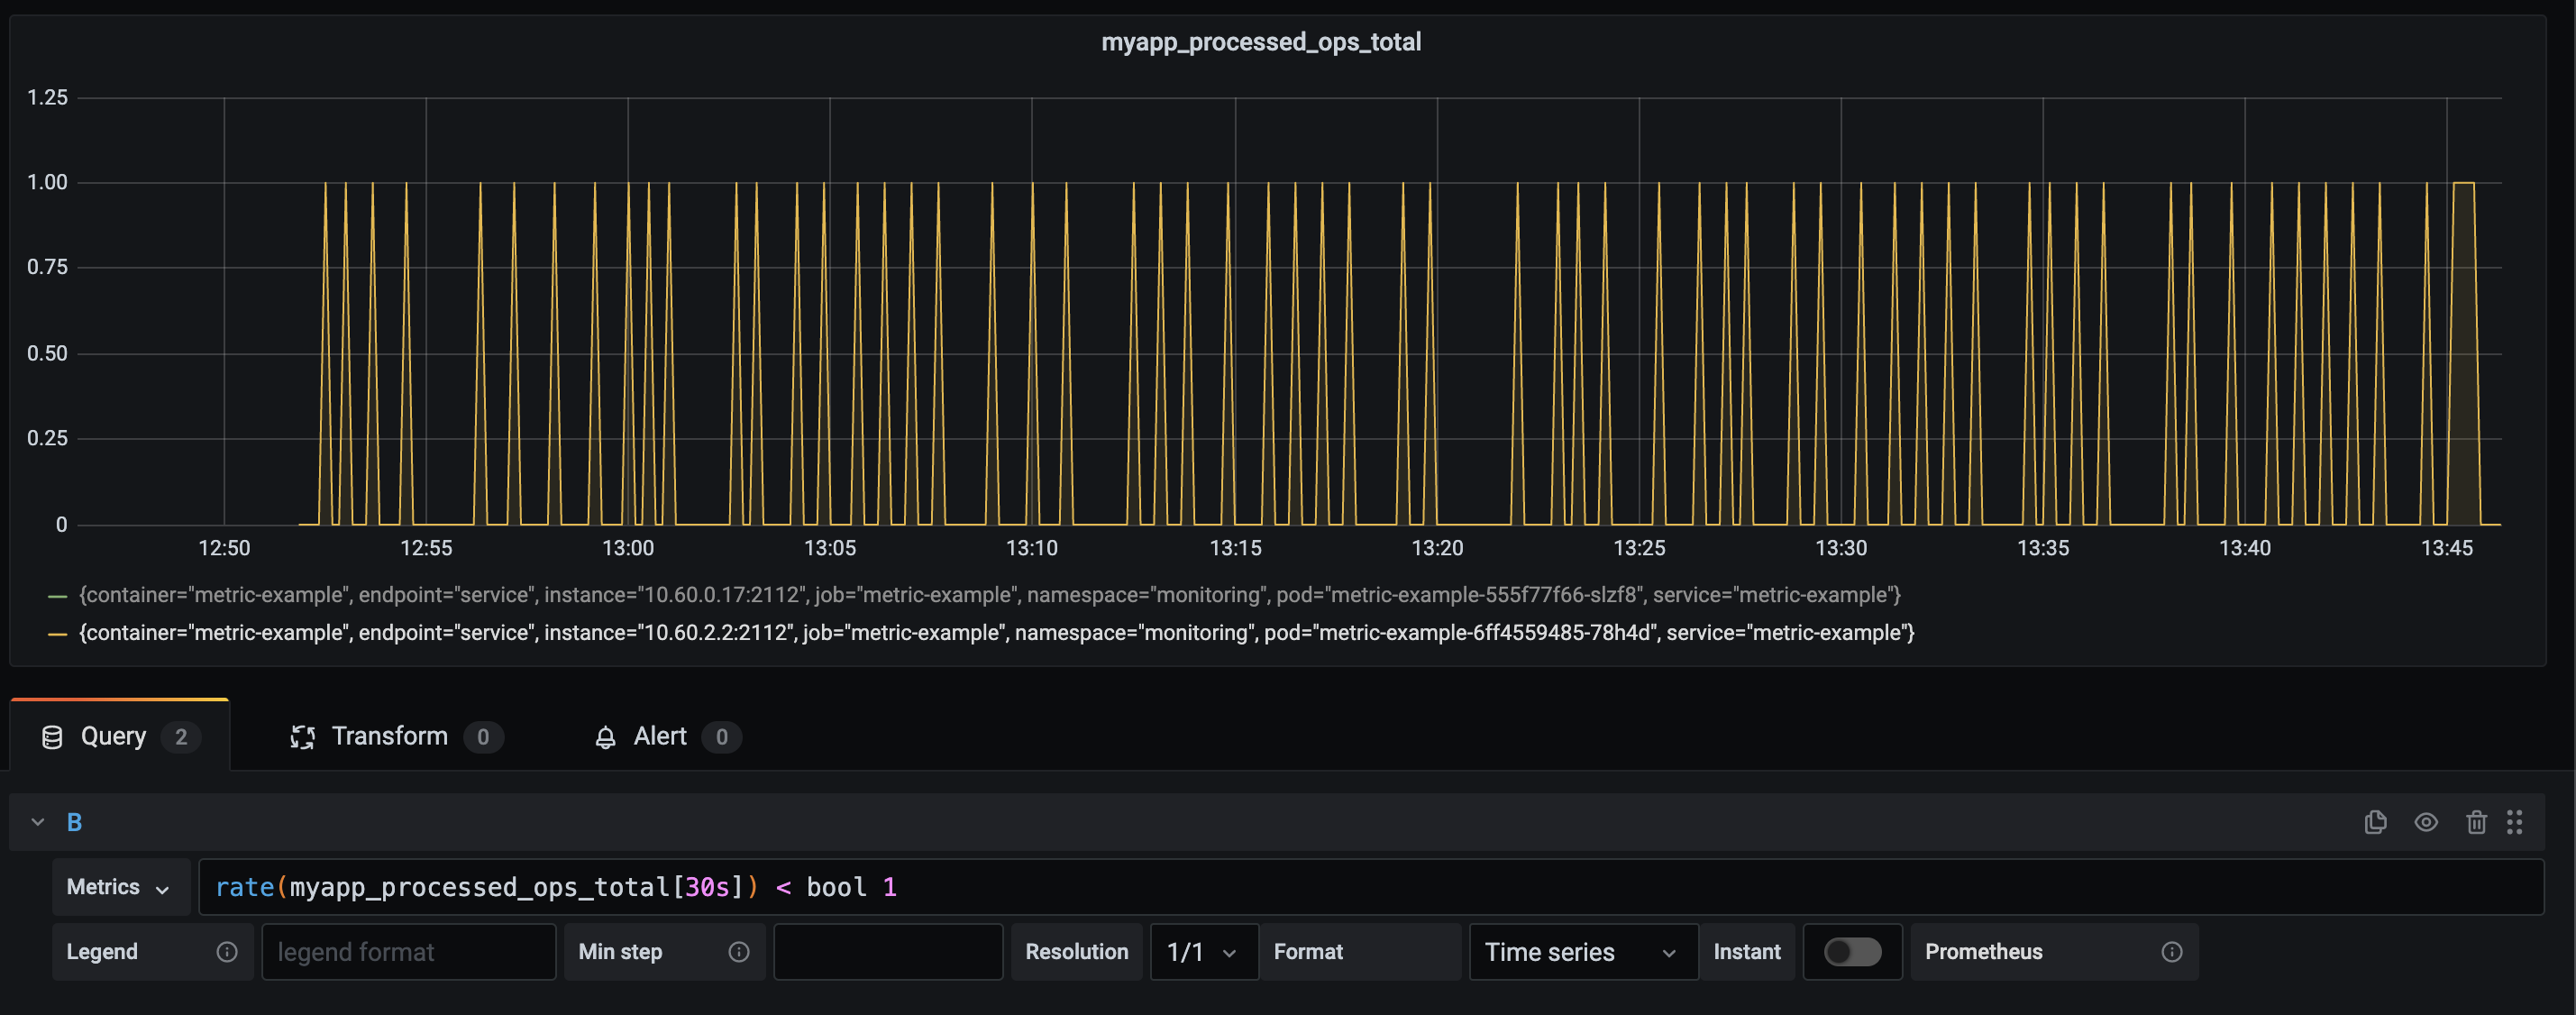
This is quite annoying to alert on. I would have to make something that nearly instantly would alert on a value of 0. It would then go back to an "okay" state and alert a few seconds later. Let's not do that. I'm going to convert this to an average over time. This removes some factors on false-positives but also provides a decent alerting state.
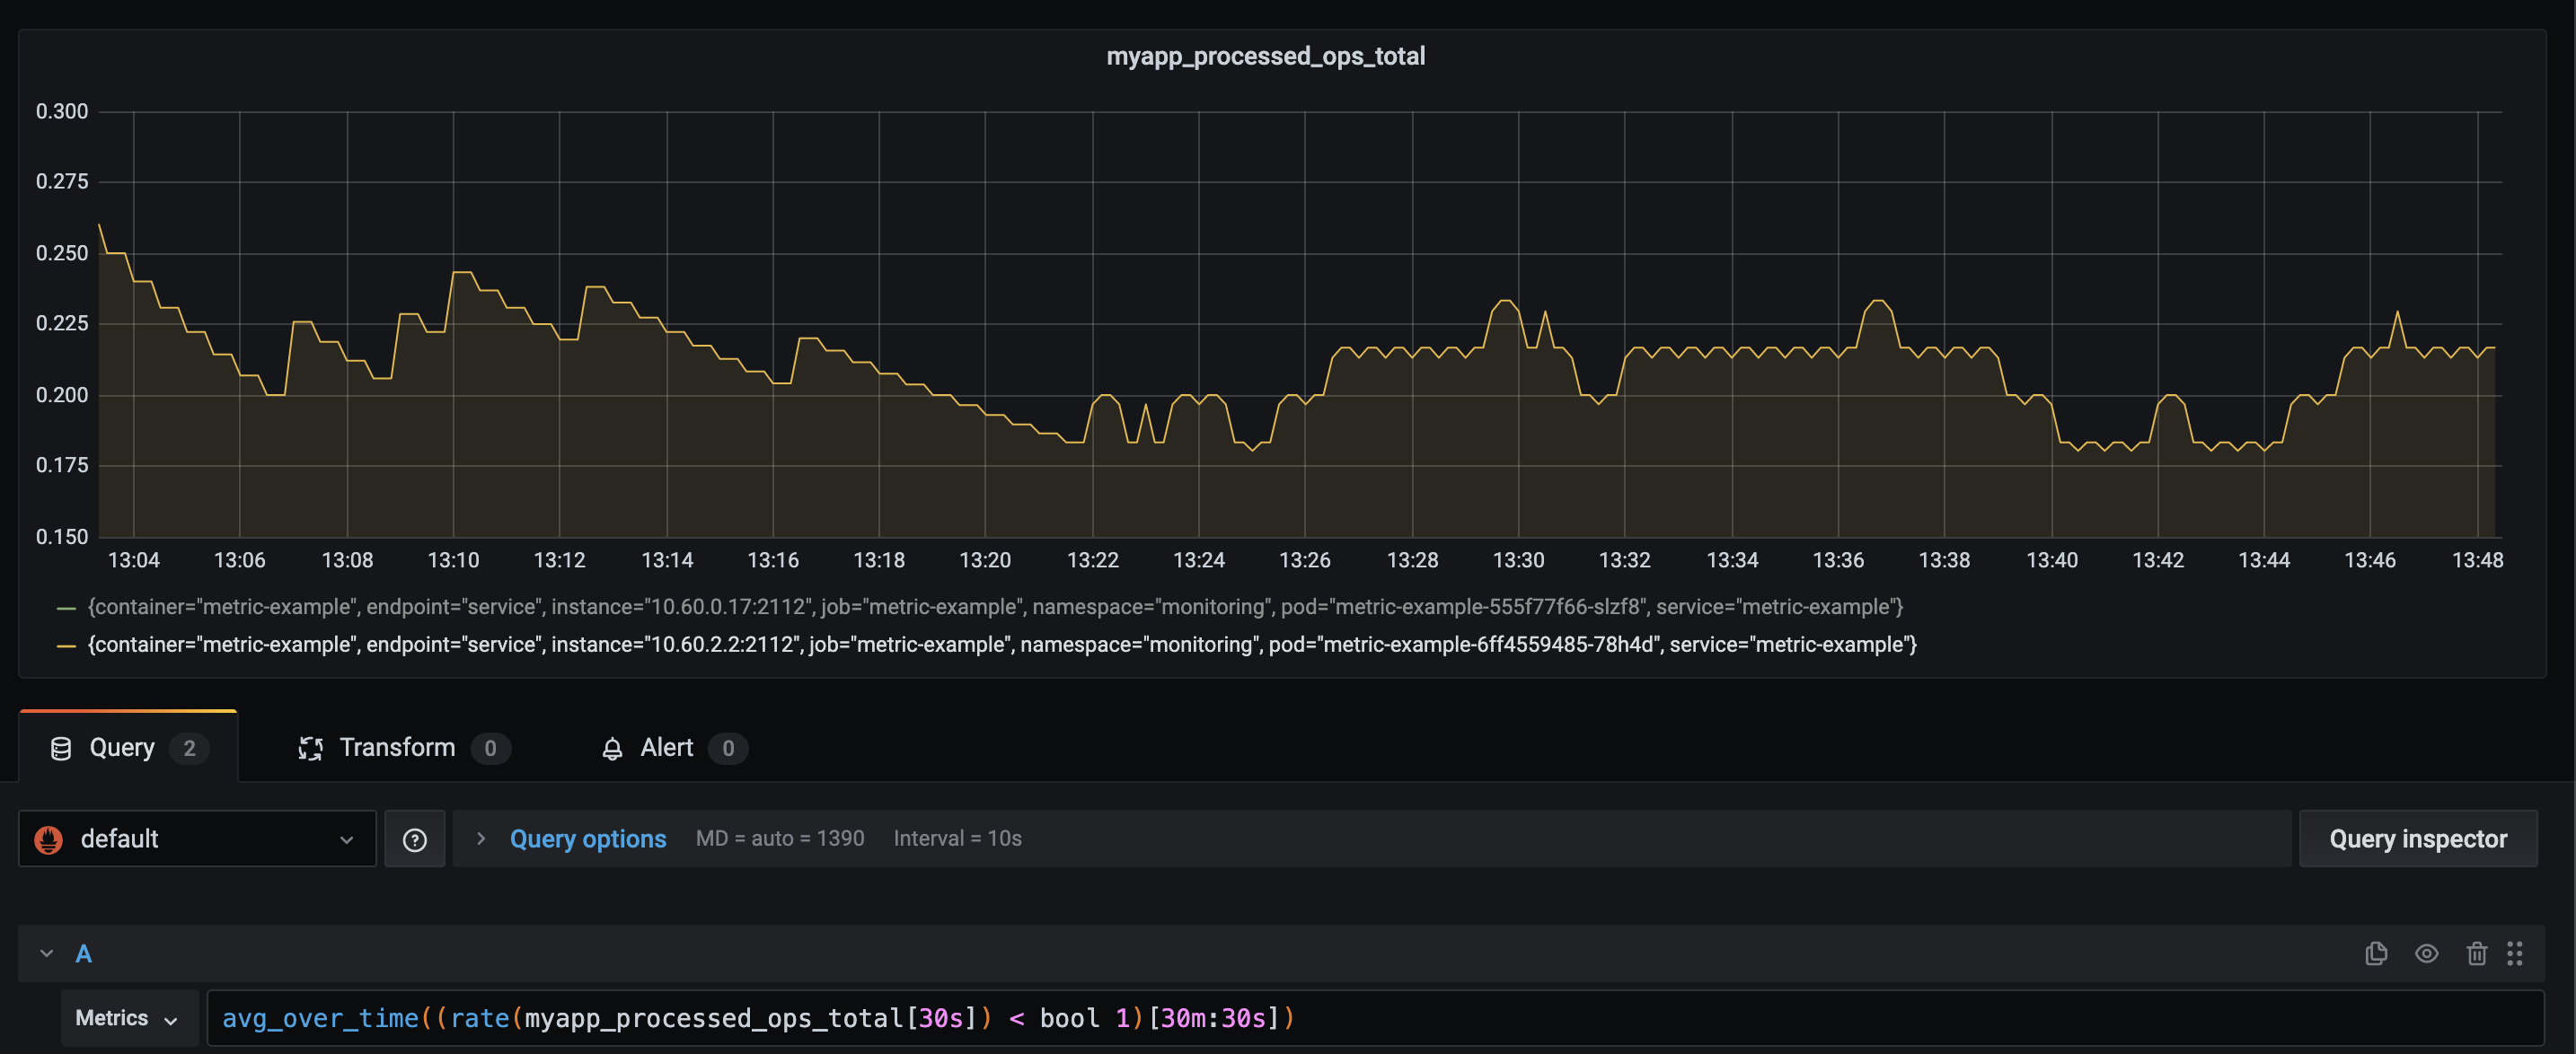
Now I could just make an alert that takes this value and alert me if the value is < 0.9. I can be confident that < 0.9 is an actual issue. This value should be something I should keep thinking about. Over time I would gain much better insights into our platform/service. If the value is about 0,99 or even 1 for an entire month, I could set my alerting to 0,95 or higher. This would now indicate better that "something is off" based on previous experiences.
It's just something that is off
I've only processed that single metric and I'm now using it to indicate a "something is off". Which is cool, yet it does not grasp the entire situation. The next step would be to incorporate more metrics. Also, not just metrics from "my system" or "my application". To get the best bang for my buck I need a global overview of everything that my application is 'touching'. If I use a database, I need information about this database. Am I using load balancers? Please do give me information regarding my network quality, load balancer "processing", DNS performance, open connections, etc.
Combining these different metrics could provide me way better insights into what my service is doing. I take the inputs, the outputs and this I observe.
We can further enrich this with traces and logs. Everything combined would eventually provide me good insights and capabilities to prevent issues and solve issues. It gives me the possibility to understand the entire stack. Perhaps this is a bit of a teaser. For now this blog is about how we should think less of "uptime" and more about usefull information.
But Wiard, this is so much work, it is not easy and just simple
Yea, I have this discussion quite often. I also have more often the discussion on why something is not working, and nobody knows why the f*** it's not working. But yes, your "monitoring" solution was easy and took hardly any time.
I'm not sure how else to put this. If you want proper insights and observe systems you have to think about things you do. It's like going groceries without a shoppinglist. Chances are you come home with a ton of things you don't need, you missed the things you wanted and payed 30% more than you thought you would.
Modern observability tools have ways to make things easier in the end. There are Prometheus exporters, Telegraf agents, automatic discovery, infra-as-code, cloud-native setup, dashboard generators, and the list goes on. It's just about investing in a proper setup, doing the right things, and using the possibilities that are there. It's the investment you make to start understanding what is going on. A simply HTTP request every minute will NOT give you that understanding nor it provides proper information of the state. It's that realization that hopefully pushes you towards a new way of working and thinking about your systems. I also hope, that eventually, you don't bother about "uptime" anymore. Not because you simply don't care, but because you have so much better insights for yourself, your company, your colleagues, and your customers.