Getting started with Prometheus and Thanos

I've spent some time working with various "observability" tools. I thought to share my experiences of building such a setup in an Enterprise environment. In no way, I want to profile myself as a huge expert on this subject. Yet I believe sharing knowledge and experiences is something everyone should do.
Understanding the basics
As always it's pretty straightforward to run some helm charts and voila you've got a stack. When you are really starting, or even if you are quite experienced, it does not hurt to (re-)read these pages: https://prometheus.io/docs/concepts/data_model/ and https://en.wikipedia.org/wiki/Time_series
In the end, the bottom line is that we process time series: streams of timestamped values belonging to the same metric and the same set of labeled dimensions. One could argue: But I only maintain the stack/platform. What is my interest in what my (end)users are processing? Well, perhaps this might be valid for a few days/systems. Trust me that you eventually have to deep dive into these matters because it can ruin your platform. Not organizing, maintaining, and being selective on your time series can have a huge impact on storage, performance, latency, etc.
Collecting and storing data in Prometheus
Often we talk about "scrape". You fetch the metrics on an endpoint (often /metrics) and it gets stored in memory. Behind this is a write-ahead-log (WAL) to be resistent on server failures. Every 2 hours a block gets created. A 'tsdb' (time series database) which is blocks on your local file system that consist of grouped data of those 2 hours per block.
Eventually those blocks will be compacted into larger blocks. Depending your retention policy this is either 10% of your retention period, with a maximum of 31 days. P.s. you can read more about the tsdb here: https://github.com/prometheus/prometheus/blob/master/tsdb/docs/format/README.md
And.. how do we scrape
Well, via the scrape_config. This section defines how/what/when we scrape things. This can be quite advanced with various options and methods to do this.
So in our global configuration file we can define.. dumdumdum Global settings (such as the scrape_interval) which gets used as default when you do not specifiy these in the scrape_configs. Yet we also define a list of scrape_configs. A scrape_config section specifies a set of targets and parameters describing how to scrape them. In the general case, one scrape configuration specifies a single job.
One of the most basic options in our scrape_config is the static_config. Just as the name tells you: a static way to define targets. For the static_config it is sufficient to pass along the following:
1#The targets specified by the static config.
2targets:
3 [ - '<host>' ]
Going further
What we have discussed so far is how metrics can be fetched and how this gets stored - For Prometheus. Yet we can go much further.
How do metrics look like?
and pitfalls..
It starts with a metric name. A common metric name is up which has a value of 0 or 1. Either a host is up or down. Such entry might look like this:
1up{job="<job-name>", instance="<instance-id>"} 1And then we also notice something else, such as the job= and instance= which are labels. Labels can be your friend or foe. Let's assume they are our friends for now. A label can provide more information about "the metric". In a way that we can query for specific metrics. If we are consistent we might receive the same metric from multiple hosts, with a specific label for the host.
1up{job="node-checker", instance="instance-1"} 1
2up{job="node-checker", instance="instance-2"} 1
3up{job="node-checker", instance="instance-3"} 0
Now we are able to query on the label name up where it's value is 0. Because we really would like to know which node is down and it would give us the instance as extra information.
We can also keep extending this by adding an extra label group (or whatever name floats your boat)
1up{job="node-checker", group="linux", instance="instance-1"} 1
2up{job="node-checker", group="linux", instance="instance-2"} 1
3up{job="node-checker", group="windows", instance="instance-3"} 0
And then we would have an overview that we can see that our Windows server is down.. again. wink. This makes it to some extend easier to group metrics, create certain dashboards, etc. etc. Yet we can also make this our enemy.
You will kill your Prometheus if you start using some form of dynamic label values. Julius Volz gave a talk in 2017 on PromCon, which gave a few funny (yet actually realistic) use-cases which will blow up your Prometheus:
- public IP addresses
- user IDs
- SoundCloud track IDs (ehem)
Why? Because you will end up with to many timeseries.
1http_request_latency{job="latency", user="12391", instance="instance-1"} 100
2http_request_latency{job="latency", user="10189" instance="instance-1"} 120
3http_request_latency{job="latency", user="98181" instance="instance-1"} 110
4http_request_latency{job="latency", user="98711" instance="instance-1"} 105
5http_request_latency{job="latency", user="12675" instance="instance-1"} 987
6...
7fin
This is only just for one instance and it will keep growing with a set which is nearly always different than the one before. In general, what you want is that the only value that changes, is the value of the metric itself. Not a label!
Architecture
And we step a little bit deeping into our subject. Take a look at a general architecture picture of what is possible.
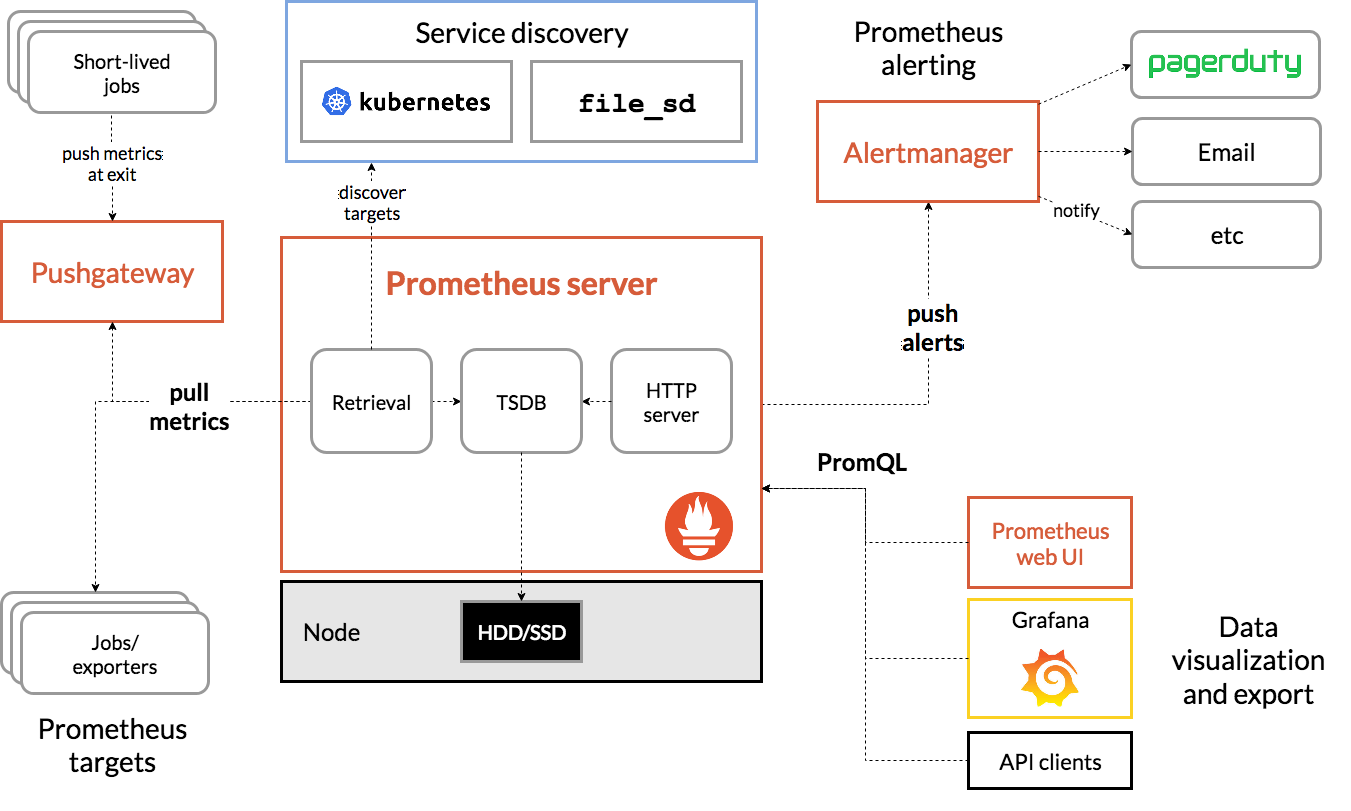
Push gateway
In our subject on "how do we scrape", you will now see that there are more options for your 'scrape targets'. Also that it is possible to push metrics! Now a real personal note on pushing metrics: I don't use it in this way. For the simple reasons:
- I'm less in control
- I have no idea what people are pushing
- I can't control the rates
- There are some other downsides that you can read here: https://prometheus.io/docs/practices/pushing/
There is a solution which allows your to push data to a different "gateway", in which that gateway can be scraped by Prometheus. My take on this is to:
- Setup a Telegraf agent with an input for Influxdb_listener
- With an output for Prometheus_client
- Push data to this Telegraf Agent
- Scrape this agent with Prometheus
Yes, there are also downsides to this, but personally I believe this is a far more robust solution.
Exporters
Exporters are also some type of gateways. In general exporers do an action (I.e. export metrics from X system) and be available for Prometheus to get scraped. The exporter will "do it's thing" when it gets scraped by Prometheus. Exporters are great for systems that do not expose metrics, but perhaps provide these via an API call. An Exporter can then make sure Prometheus can fetch this data.
Downsides of Prometheus
I'm going straight towards the downsides of Prometheus because these downsides can be resolved by Thanos (or Cortex). Knowning your "flaws" makes it easier to deal with it.
We can't scale horizontally out of the box
So when we have an instance of Prometheus, we are unable to just add another instance without dealing with our scrape targets ourself. Prometheus does not "share" the targets between instances. So while it is possible to run two instances, it also means targets will get scraped twice and more importantly: We have the data twice.
It is possible to setup multiple instances of Prometheus and distribute the load. A somewhat "common" setup is to do the following:
- Prometheus X
- scrape targets 1-99
- Prometheus Y
- scrape targets 100-199
- MainPrometheus
- scrape Prometheus X and Y with federation
Read more about federation here: https://prometheus.io/docs/prometheus/latest/federation/
Storage
And the other downside is storage. We are just limited on what our hostsystem provides on storage. Obviously we can go mad on the storage part and Prometheus can actually deal with massive amount of storage. Though in a somewhat modern world we want this to be a little bit more "cloud native". S3 would be solid solution ;)
Why we want Thanos (or Cortex)
I will focus on Thanos for this blogpost, but the capabilities of Cortex are near identical.
Thanos will solve a few downsides of Prometheus, which gives us a worthy platform. We resolve our high-availible setup and storage. The next part is a little copy/paste of the Thanos website itself, but it provides a perfect summery of their capabiliteites.
Global Query View
Scale your Prometheus setup by enabling querying your Prometheus metrics across multiple Prometheus server and clusters.
Unlimited Retention
Extend the system with the object storage of your choice to store your metrics for unlimited time. Supports GCP, S3, Azure, Swift and Tencent COS.
Downsampling & Compaction
Downsample historical data for massive query speedup when querying large time ranges or configure complex retention policies.
Thanos Architecture
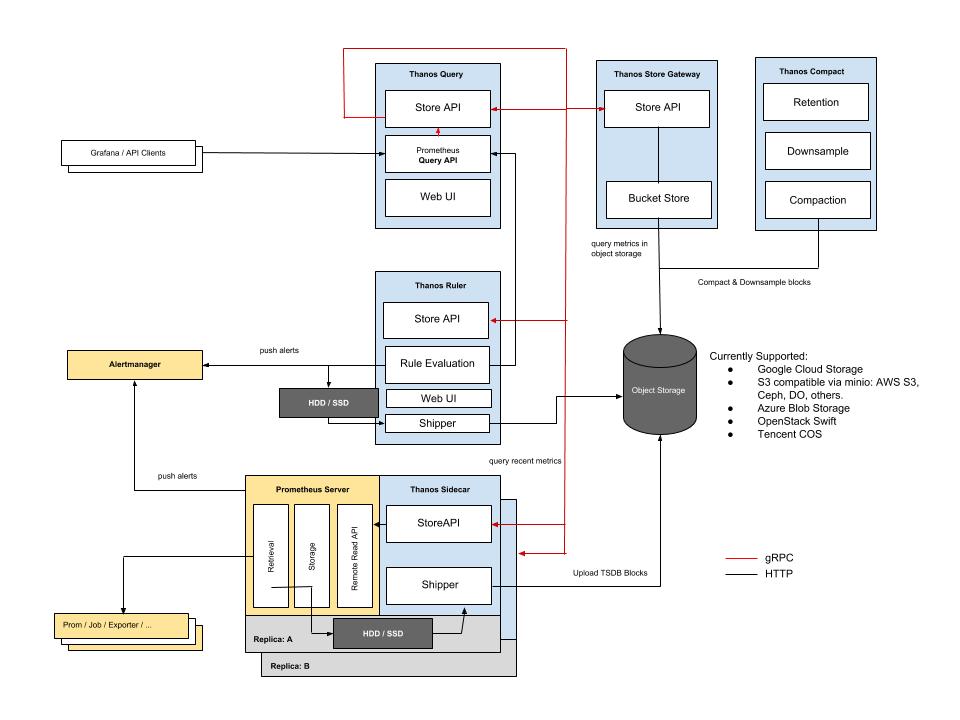
Thanos sidecar
The thanos sidecar command runs a component that gets deployed along with a Prometheus instance. This allows sidecar to optionally upload metrics to object storage and allow Queriers to query Prometheus data with common, efficient StoreAPI.
In details:
- It implements Thanos’ Store API on top of Prometheus’ remote-read API. This allows Queriers to treat Prometheus servers as yet another source of time series data without directly talking to its APIs.
- Optionally, the sidecar uploads TSDB blocks to an object storage bucket as Prometheus produces them every 2 hours. This allows Prometheus servers to be run with relatively low retention while their historic data is made durable and queryable via object storage.
Thanos Querier
Thanos Querier essentially allows to aggregate and optionally deduplicate multiple metrics backends under single Prometheus Query endpoint. Since for Querier “a backend” is anything that implements gRPC StoreAPI we can aggregate data from any number of the different storages like:
- Prometheus itself (Thanos Sidecar)
- Object store (via the Thanos Store)
- Other querier instances
- OpenTSDB
Thanos Store
The thanos store command (also known as Store Gateway) implements the Store API on top of historical data in an object storage bucket. It acts primarily as an API gateway and therefore does not need significant amounts of local disk space. It joins a Thanos cluster on startup and advertises the data it can access. It keeps a small amount of information about all remote blocks on local disk and keeps it in sync with the bucket.
Combining everything together
We can now leverage Prometheus in a setup that we are not limited to a single instance of Prometheus. We can setup multiple instances of Prometheus that can be queried by our Thanos Querier. We are basically not limited by any technical factor anymore.
Pricing & storage
What is relevant to know is that:
- Thanos sidecar uploads data in blocks, every two hours. This means we don't have many PUT files.
- Thanos compactor (not covered yet) compacts blocks further for longer term retention
- Thanos Store caches data
This assumes we also run our cluster in AWS, if we check AWS pricing calculator for 10TB(!) we have the following price: 10240 GB x 0.0230000000 USD = 235.52 USD per month.
Since "actions" also cost some $$, this becomes near zero. Since we hardly have any requests towards S3. Just to include it so you are still aware of it: 1,000,000 PUT requests for S3 Storage x 0.000005 USD per request = 5.00 USD - and this is quite a lot, you won't hit this...
Ending..
This was an intro into Prometheus and Thanos. I will start to write a few more blogs in the future on how to setup a proper stack on Kubernetes.